The Diversity of STEM Characters in the Movies
By Dr. Bryan Mendez

|
|
Luke Skywalker and R2-D2 from Star Wars (1977).
|
I love the movies! My earliest memories are of going to the movies to see Star Wars. That film sparked my interest in space, which eventually led me to earning a Ph.D. in astrophysics from UC Berkeley. Along the way, there were other media influences that further stoked my interest in space and science. The Star Trek franchise, and the character of Spock in particular, probably did the most toward inspiring me to consider a career in STEM (Science, Technology Engineering, and Mathematics).
|
|
Mr. Spock from Star Trek II: The Wrath of Khan (1982).
|
I’ve often wondered if other STEM professionals had been inspired by media role models. My anecdotal evidence from friends and colleagues suggested as much. There has been a lot of research suggesting that role models in real life have a powerful influence on the development of STEM identity (being able to imagine yourself in a STEM profession). There has also been some research that even fictional role models in the media can have nearly the same influence as real-world role models. That’s especially powerful for people living in places without easy, direct access to a lot of STEM professionals.
Considering the power that media, like the movies, can have in inspiring STEM identity, I’ve been wondering about the diversity of STEM characters. Many STEM fields in the United States lack diversity of any kind, which creates a barrier, especially for young people, to find STEM role models. Is that lack of diversity in real life reflected in the movies? Having watched thousands of movies over the years, my impression was that STEM characters in the movies are not very diverse. But, I wanted to be a little more rigorous than that. So, I set about quantifying the diversity of STEM characters in popular US films. Here is what I found...
The Films
Because I’m curious about the role model effect, I wanted to examine the diversity of STEM characters in the most popular films in the United States. But, I needed to define what popular means in this context. One way to define the popularity of a film is how much money it makes at the box office. Box Office Mojo keeps track of that kind of data. I examined their list of the 1,000 top box office films of all time, adjusted for inflation.
I took the Box Office Mojo list and adjusted it for a ‘per capita’ calculation. I divided the number of tickets sold by the U.S. population in each decade since 1920. That gives an estimate of the percent of the population who saw the film at the time of its release.
In the final list, there were 410 films at 10% population share or greater.
I reviewed all 410 films, a majority of which I have already seen (they are the most popular movies after all, and I’m a big movie fan). For the films I hadn’t seen, I relied on Wikipedia synopses, IMDB data on casts, and occasionally I skimmed the scripts available at thescriptlab.com.
I determined that 161 of the 410 most popular films had STEM characters important to the story. I created a list of these 161 films at Letterboxd. Star Wars is #1 and Star Trek III: The Search for Spock is #161, so it was perfectly bookended from my perspective.
The Characters
I wanted to include characters with STEM expertise broadly. The characters I looked for are not necessarily just research scientists or academics. Sometimes they are a technical whiz whose skill features in the plot.
The kinds of STEM expertise I considered were:
-
Science
-
Physical Science
- Astronomy/Astrophysics
-
Physics
-
Chemistry
-
Earth Science
-
Life Science
- Biology
-
Zoology
-
Botany/Plant Biology
-
Ecology/Environmental Science
-
Medicine/Health Science
-
Psychology
-
Neuroscience
-
Social Science
-
Archeology
-
Anthropology
-
Linguistics
-
Sociology
-
Technology
-
Engineering
-
Mathematics
I coded each character with the relative importance of their role to the story: 1 is for main characters, 2 is for supporting characters, 3 is for background characters. Overall, I identified 558 characters.
In franchise films, there are often recurring characters with STEM expertise (e.g. Luke Skywalker in the Star Wars franchise or Tony Stark in the Marvel Cinematic Universe). Initially, my instinct was not to double-count these characters. But, in retrospect I think there’s some value in counting them for each film in which they occur. My reasoning is that each time the character is in a film it is another opportunity for them to be seen as a STEM role model.
The Data
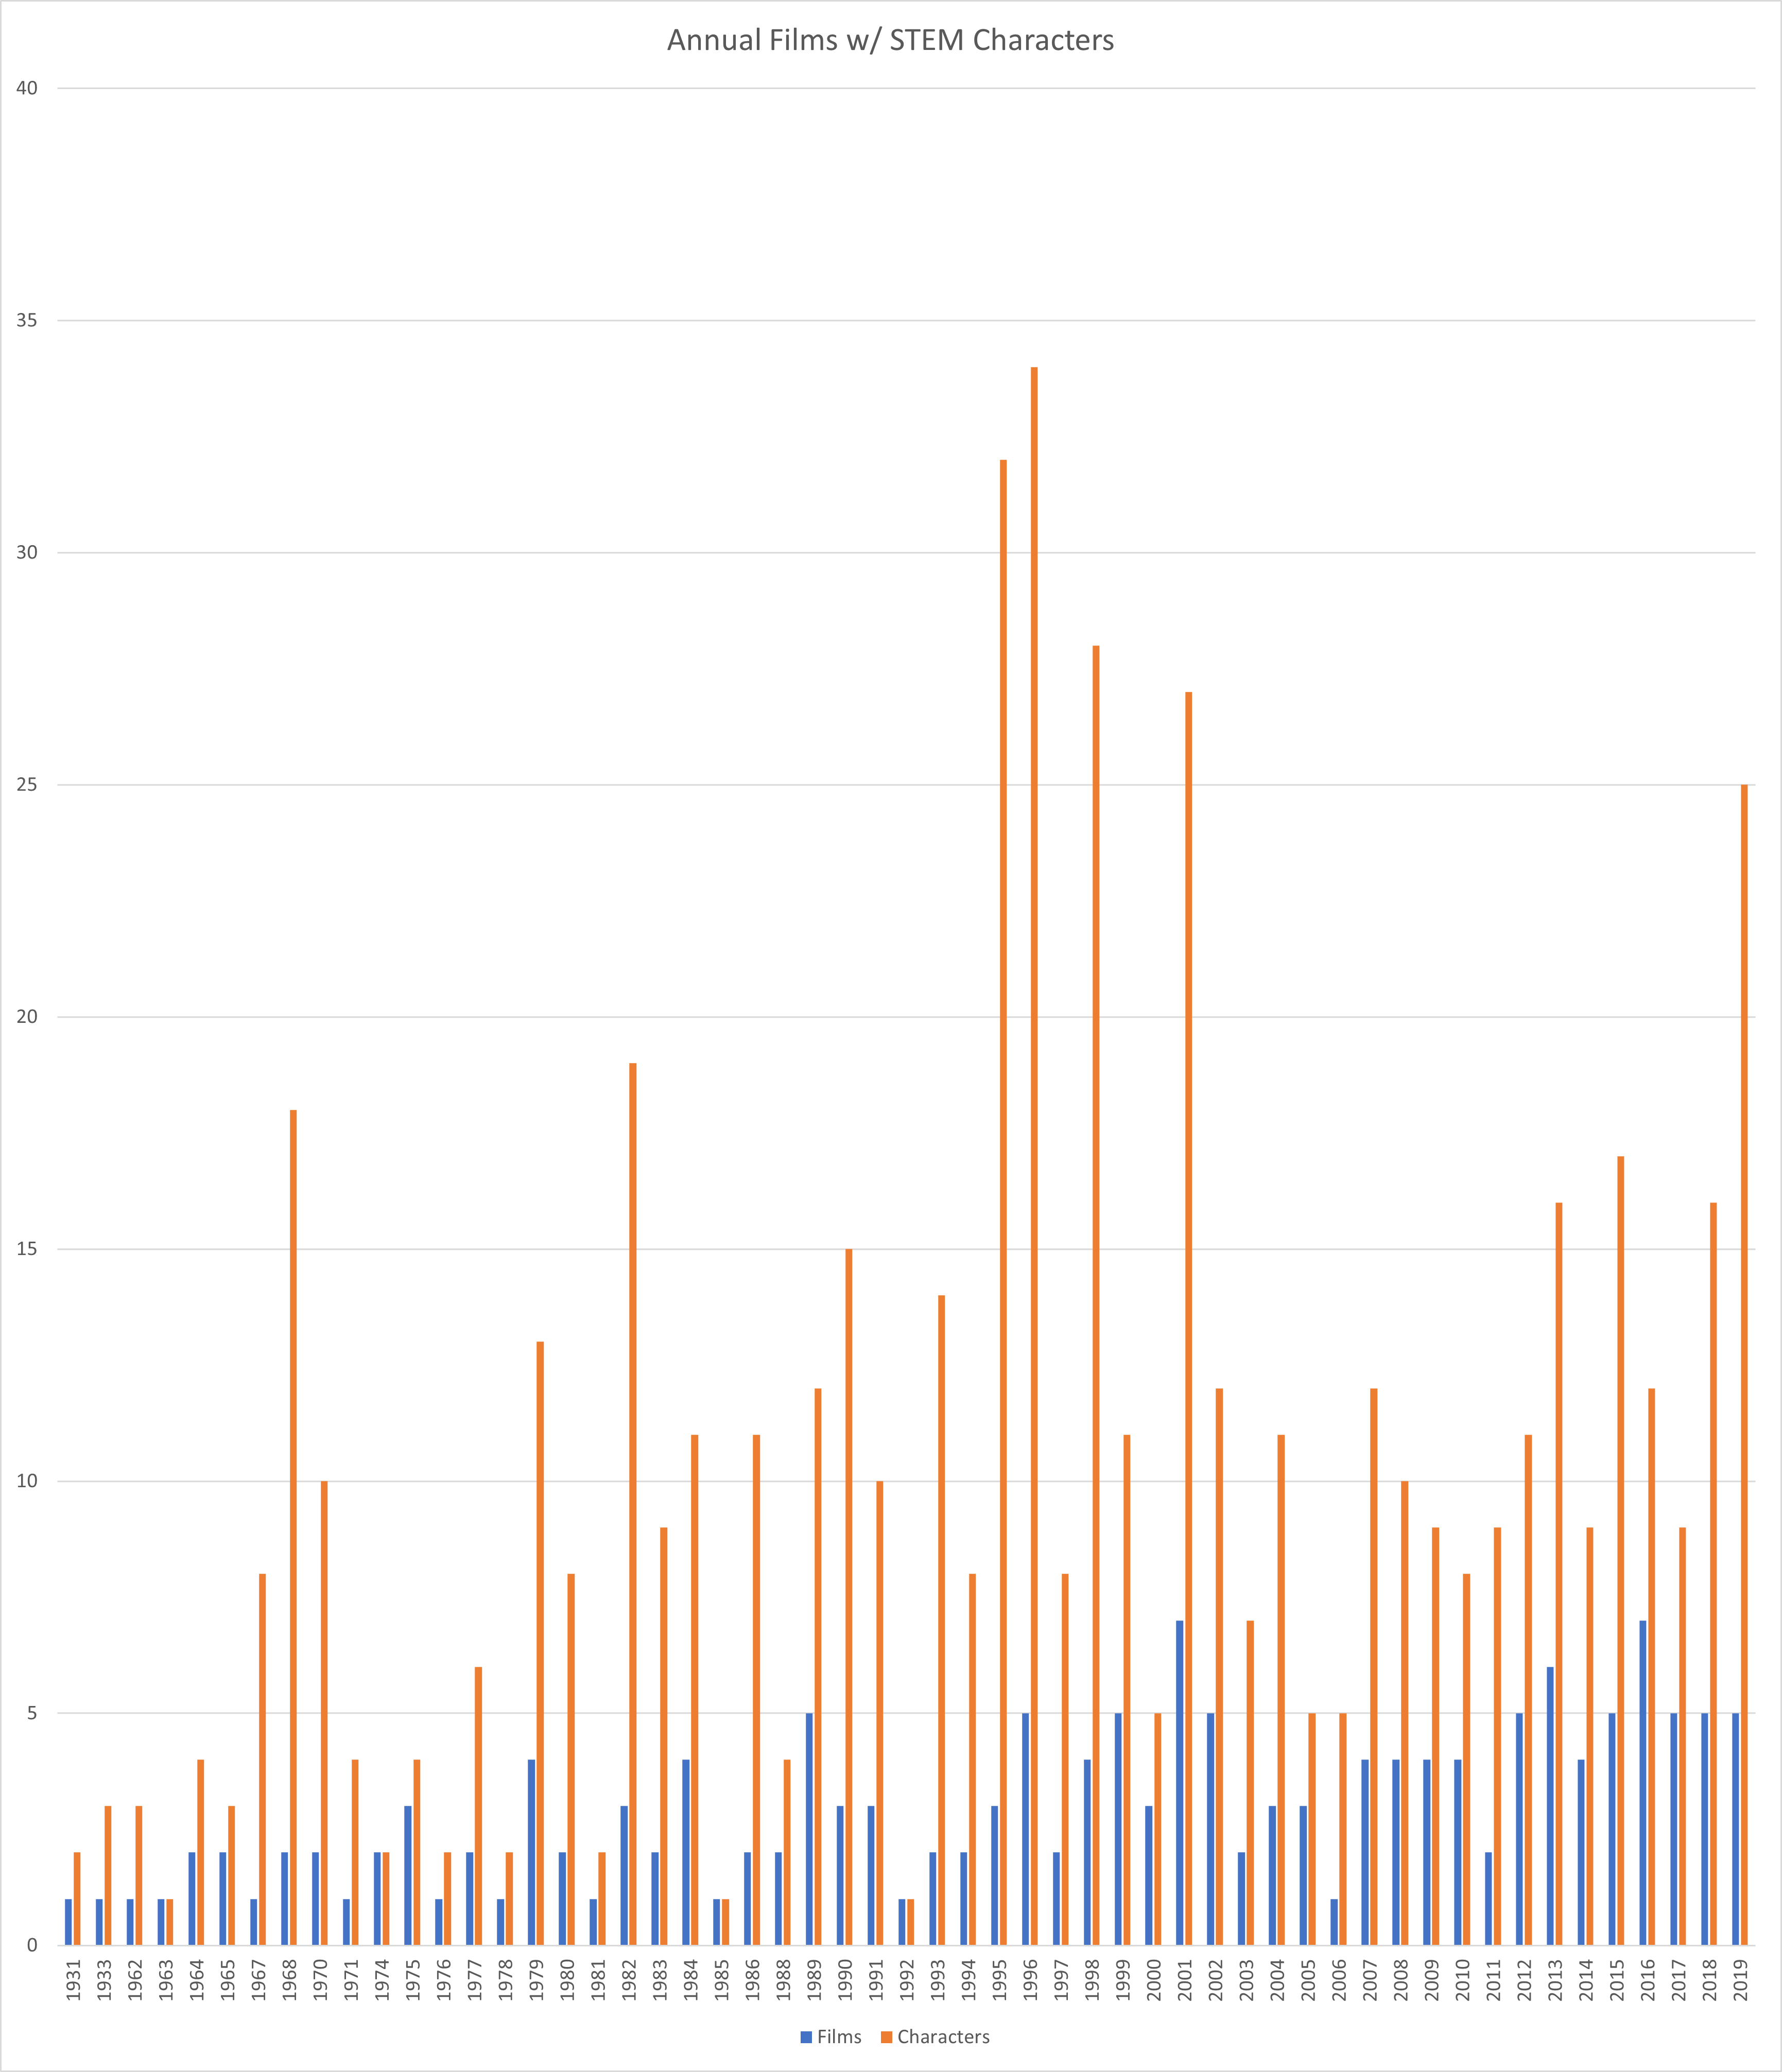
Even after accounting for population changes there were still relatively few films in the data from the first several decades of the movie industry in the U.S. (See Figure 1) In fact, only two films appear in the survey before 1962: Frankenstein (1931), and The Invisible Man (1933), which were not even in Box Office Mojo’s top 1000 films adjusted for inflation. They only made the cut after adjusting for population. Popular movies with STEM characters became more regular in the 1970s.
|
|
Figure 1: The number of films and STEM characters in those films per year.
|
This was a big surprise to me, as I grew up on a steady diet of science fiction movies, and I had always read and heard that the filmmakers making these movies (like George Lucas and Stephen Spielberg) had been influenced by the Sci-Fi films of the 1940s and 50s. I had a sense that the adventures of Flash Gordon and Buck Rodgers were a big deal. I guess now I know why those Sci-Fi films like The Blob, The Thing, or even War of the Worlds were considered “B-movies.” They clearly weren’t as popular as the “A-movies.”
Genre
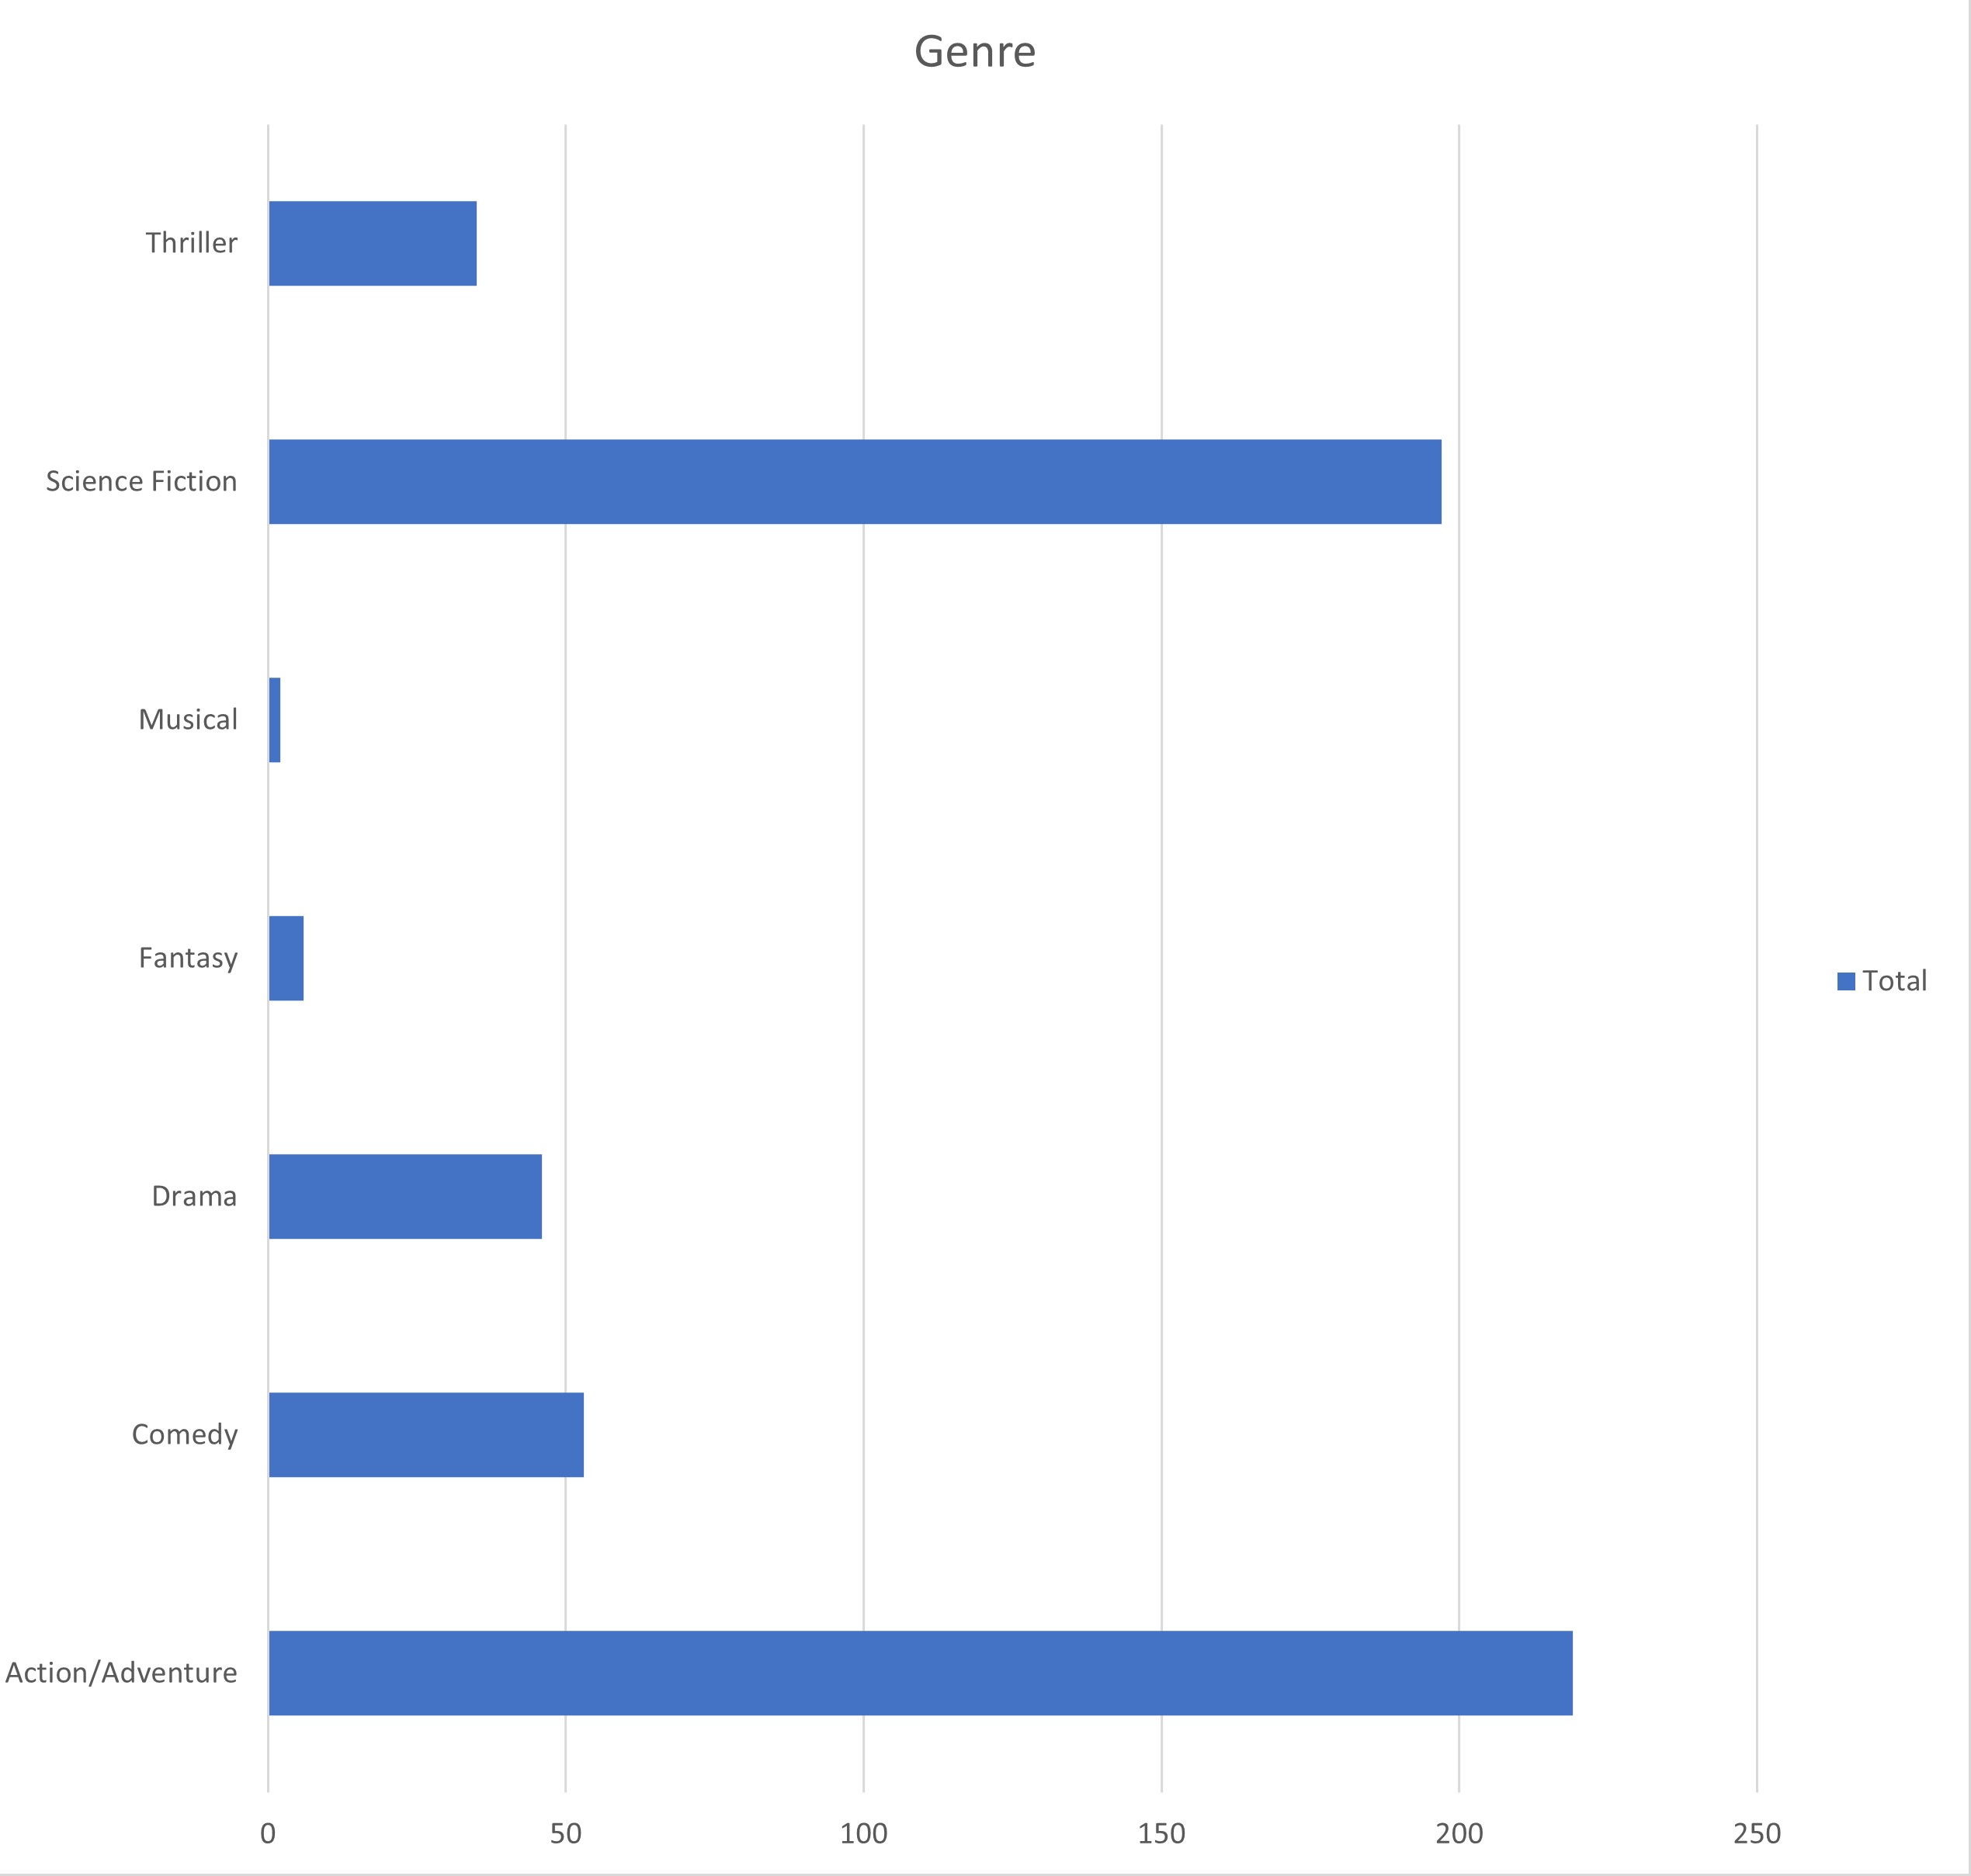
Action/Adventure films (especially the superhero and spy subgenres) are the most likely genre to feature STEM characters, followed by science fiction (see Figure 2). Comedies, which often lampoon tropes from other genres, were next most common. A majority of the dramas featuring STEM characters depict historical events and people, including NASA’s human spaceflight program in the 1960s. Thrillers, like comedies, often borrow elements from sci-fi, action, and drama films. The one musical, The Rocky Horror Picture Show, is a unique film in so many ways. You wouldn’t expect fantasy films to have any STEM characters necessarily, but some family films, like Monsters Inc. (2001), take place in worlds that, while fantastically populated by monsters, are still organized like the human world and still need STEM careers.
One note: pretty much every sci-fi film has STEM characters. That's one of the features of the genre. It was not the most common genre in this survey because action/adventure films are just a lot more common than sci-fi films, and tend to be more popular with general audiences. There’s often a lot of crossover between the two. The Marvel Cinematic Universe films, for example, are strongly infused with sci-fi, but are more generally classified as action/adventure films.
|
|
Figure 2: The number of STEM characters per genre.
|
STEM Identities
The STEM field of expertise is not usually explicitly stated for most characters. So, I did my best to identify the disciplines in which they appear to be fluent. Occasionally, they do mention the characters’ speciality and it doesn’t always match their actual work in the film, which speaks more to some lack of familiarity, on the part of the filmmakers, with STEM careers. I think some characters are said to be astrophysicists because it sounds impressive, but the characters don’t necessarily do any actual astrophysics.
|
|
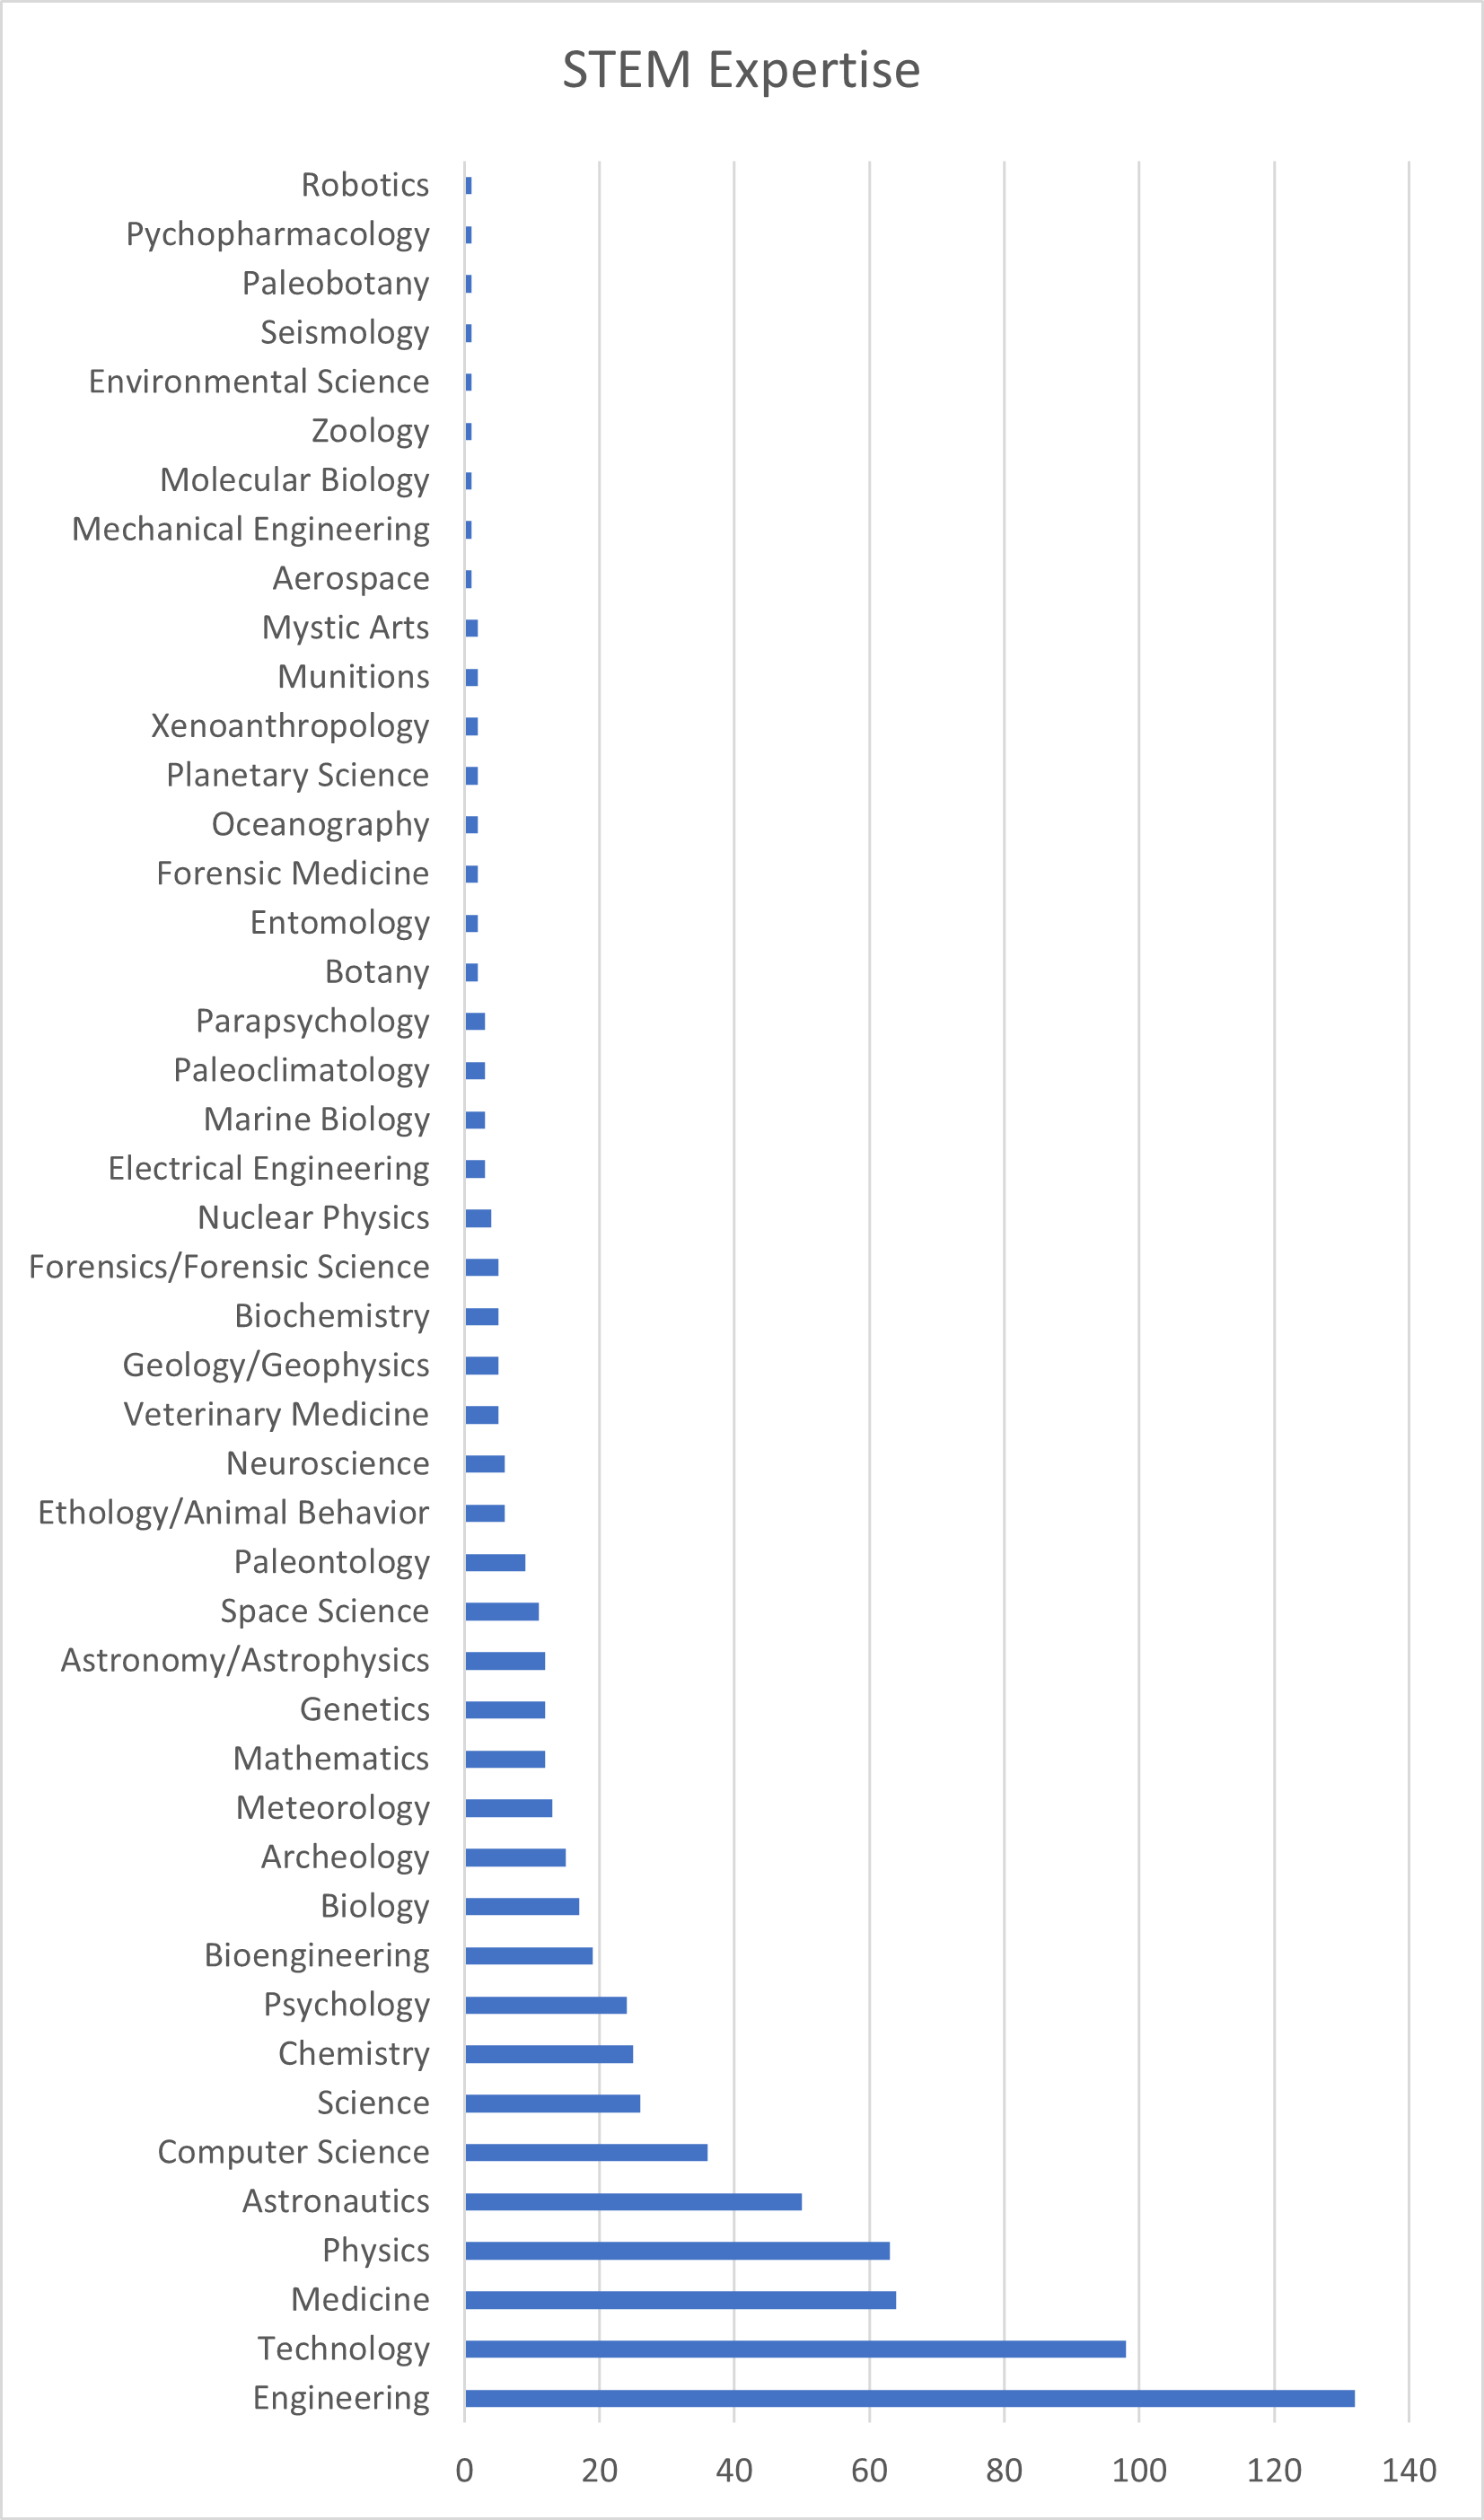
Figure 3: The number of STEM characters per area of STEM expertise.
|
The most common STEM expertise is engineering, followed by technology, medicine, and physics (see Figure 3). Mathematics is a bit farther down the list, but it is worth noting that nearly all STEM fields require facility with math. Characters coded specifically for Mathematics were pure mathematicians. There are a significant number of characters with non-specific fields of expertise, who I simply labelled as “science.”
Many characters have more than one expertise. This is a common trope in films, and one that is unrealistic. Most real-world STEM experts specialize in a single field. Engineers certainly need to have strong backgrounds in the science field of their work: physics for mechanical/electrical engineers, biology for bioengineers, chemistry for chemical engineers, and so on. Technology expertise is pretty common among STEM experts (especially engineers), but technology experts don’t necessarily need to have a background in science or engineering.
There are some characters who might not be considered STEM experts in the real world. But in films like Ghostbusters (1984) or Poltergeist (1982), the conceit of the films are that ghosts are real and therefore the expertise of “parapsychologists” is legitimate. This led me down an interesting thought path...what about witches and wizards? In the world of Harry Potter, magic is taught and learned much like science. The science fiction author Arthur C. Clarke stated that “any sufficiently advanced technology is indistinguishable from magic.” So, in stories where the conceit is that magic is real, would not magicians, witches, and wizards also be STEM experts? Why then not the Jedi as well?
While fun to consider, I decided not to go down that road...for now.
A super common trope in these films is the depiction of STEM characters as the Inventor archetype. This is a brilliant and lone person who has expertise and skill across many STEM disciplines and creates many fantastical devices. Examples: Tony Stark (Ironman), Q (James Bond Franchise), Egon Spengler (Ghostbusters), Bruce Wayne (Batman), Lucious Fox (Batman Begins), Doc Brown (Back to the Future), Shuri (Black Panther), Otto Octavius (Spider-Man 2), Edna Mode (The Incredibles), Dr. Nefario (Despicable Me), Wayne Szalinski (Honey, I Shrunk The Kids), etc.
This trope is a popular and persistent stereotype of scientists in pop culture. In my opinion, it is harmful for building STEM identity in youth. Don’t get me wrong, I love these characters. But, in the real world, STEM professionals rarely have expertise across multiple disciplines. They tend to work in teams, not alone. And most importantly, brilliance is rarely a key to success in STEM. Passion, determination, perseverance, and hard work are usually much more important characteristics for success in STEM careers.
I binned the disciplines to see how the broad categories of STEM were represented across all these films. I used the scheme referenced above.

|
|
Figure 4: The number of STEM characters per general STEM field.
|
Life & Physical Science, Technology, and Engineering are all equally represented, with Mathematics being the least common discipline to be depicted in popular film (Figure 4). Note: I also consolidated fields that draw from several disciplines like paleontology, forensics, bioengineering, and astronautics into the category of Interdisciplinary for this chart.
Diversity along other Dimensions of Identity
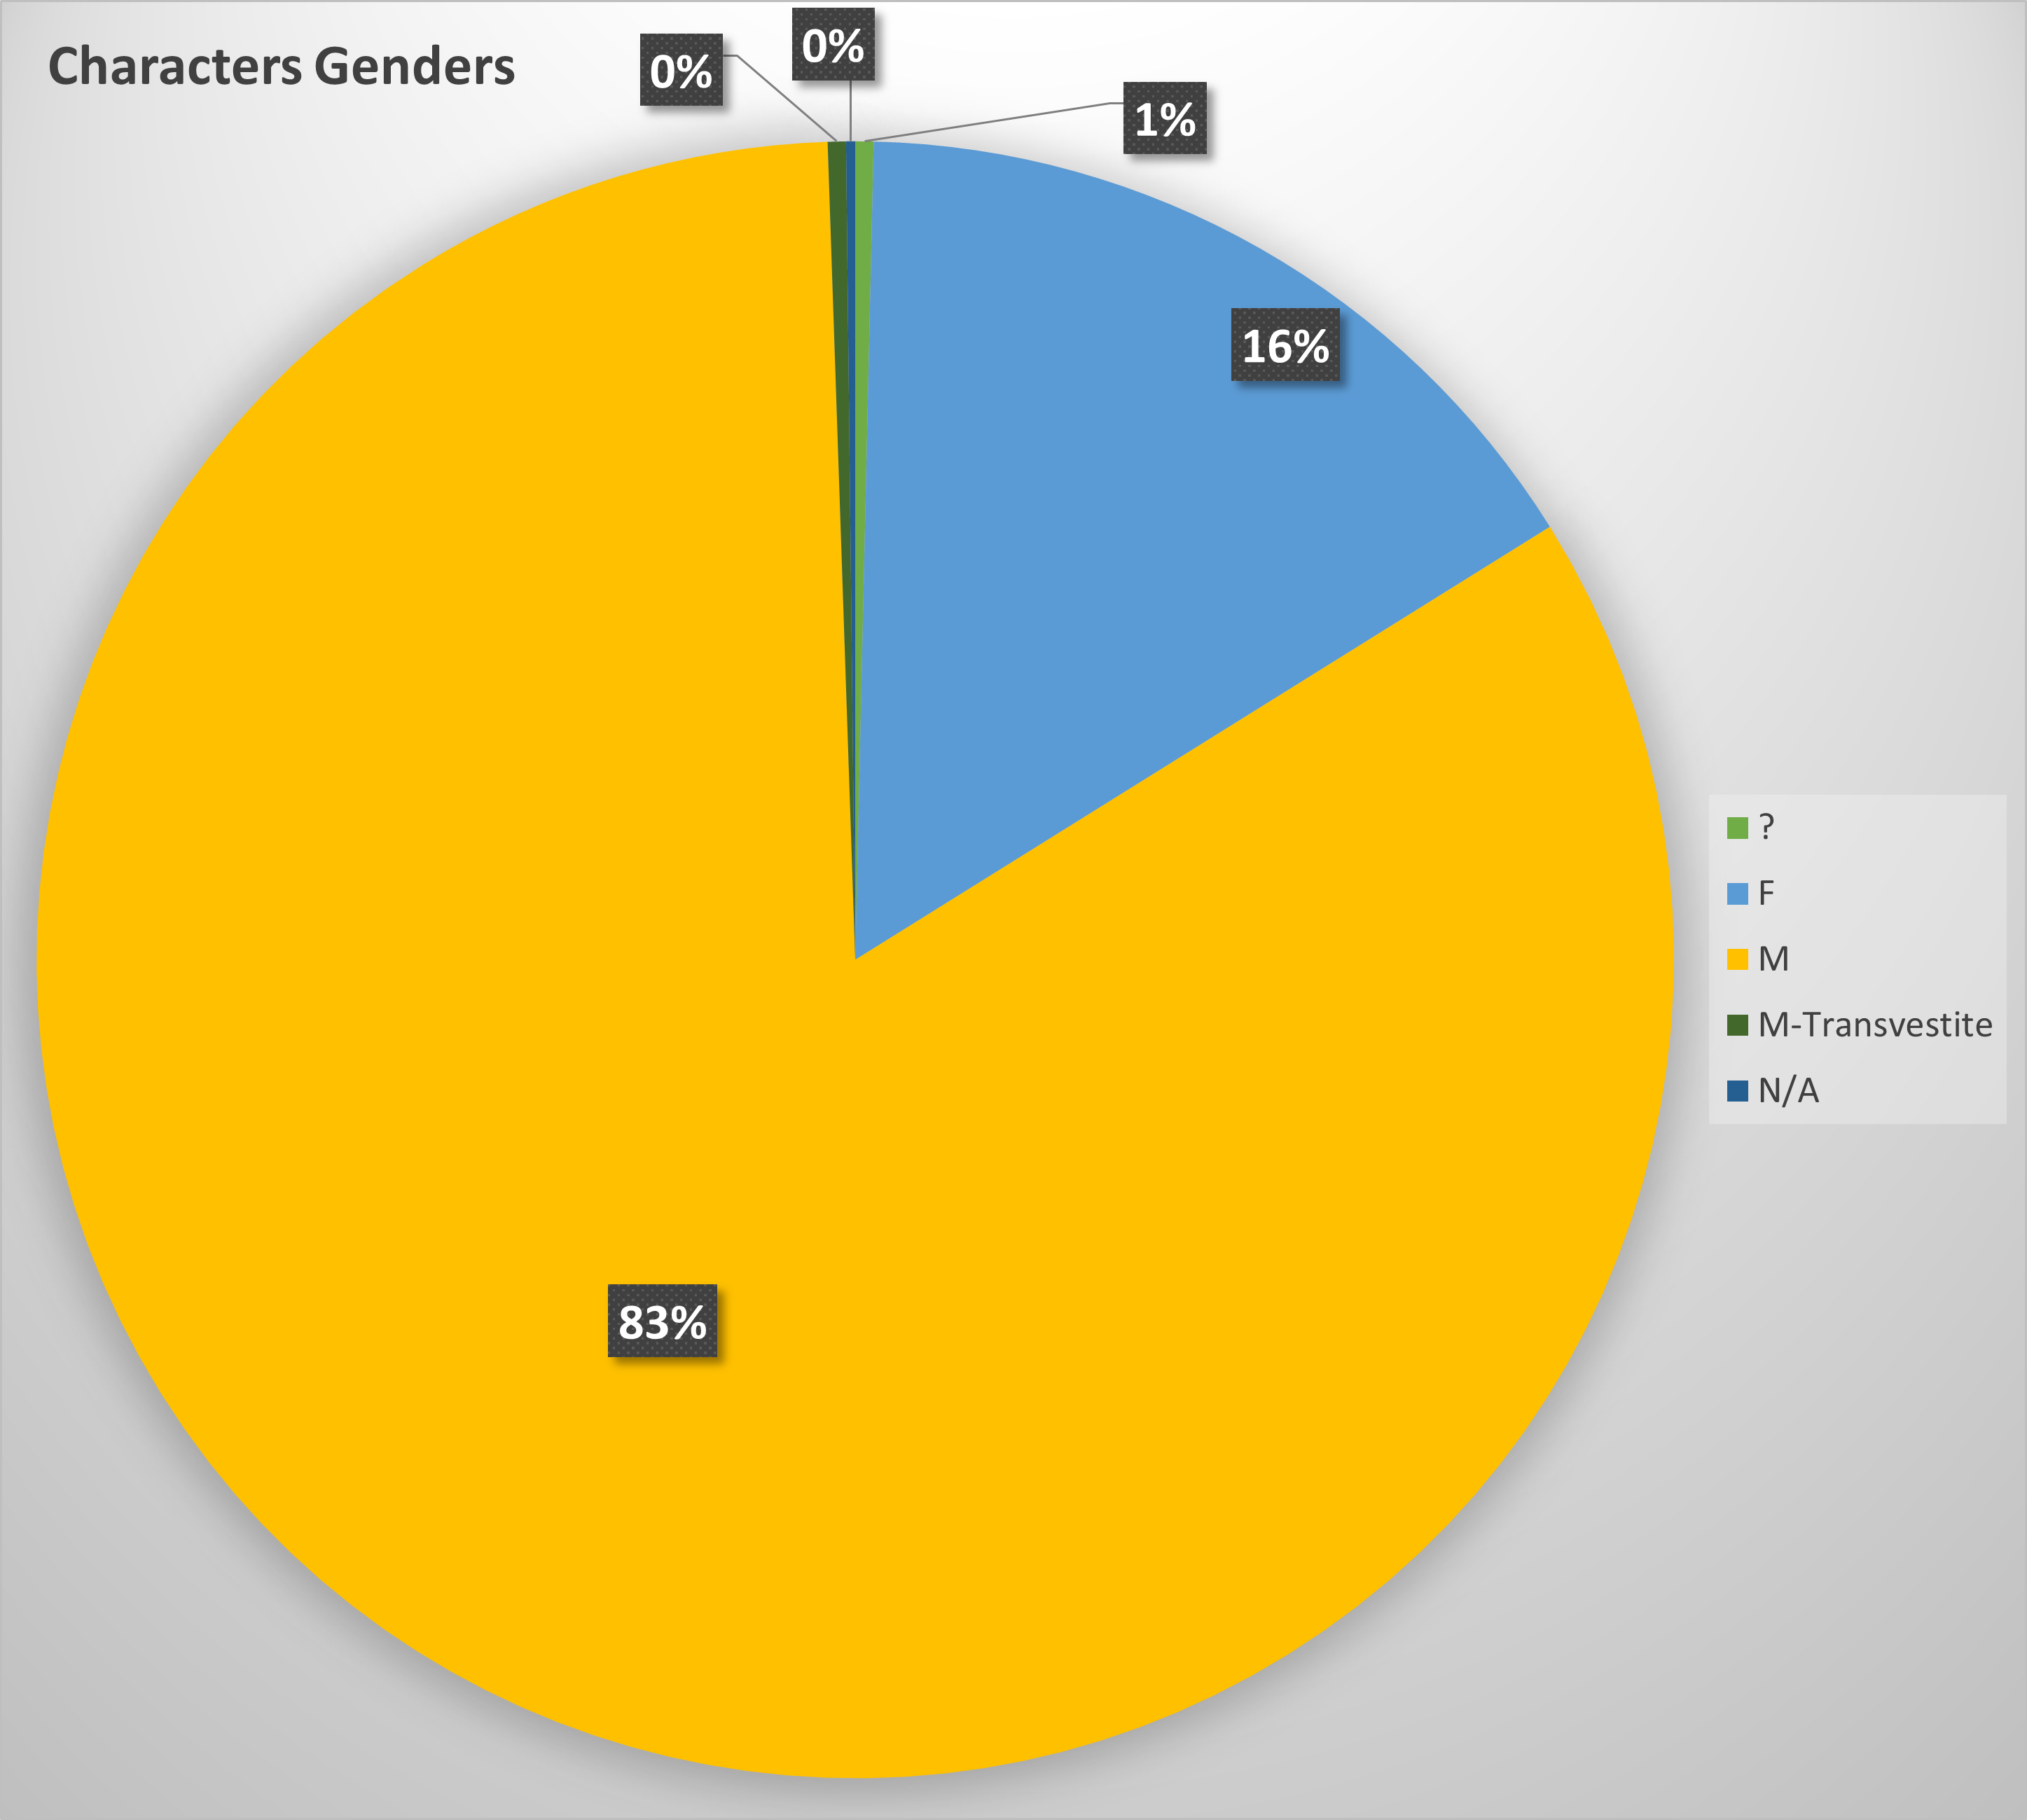
Gender
STEM characters in popular films are male by a 5:1 ratio over females. I found no examples of explicitly transgendered people. I originally had planned to identify the difference between explicitly cis-genered characters and those whose biology was unspecified. But I quickly discovered very few characters are explicitly portrayed as cis-gendered. One could make some assumptions, such as, if they have children then they are probably cis-gendered. But even then, it is not usually explicitly stated that their children are biological children. These films treat gender and sex according to the predominant binary/biological conception in Western society of the past 100 years, which has been evolving in recent years toward a more nuanced model of gender/sex.
|
|
Figure 5: The relative proportion of STEM character genders.
|
The several non-human characters in the survey are usually coded with either a male or female gender. For alien characters we shouldn’t expect gender to have the same meaning as it does in human societies. Take E.T., for example. I think they ought not be coded with a gender; although characters in the film refer to E.T. with male pronouns like he, him, and his. There is a line where Elliot tells his sister that E.T. is a boy, and since it is established that E.T. and Elliot share a psychic bond, Elliot may be expressing more than just his opinion that E.T. is male. There are some robot characters with non-human appearance. Characters like C-3PO and R2-D2 in Star Wars do not really have gender, but are portrayed by male actors/puppeteers, and the other characters also refer to them with male pronouns.
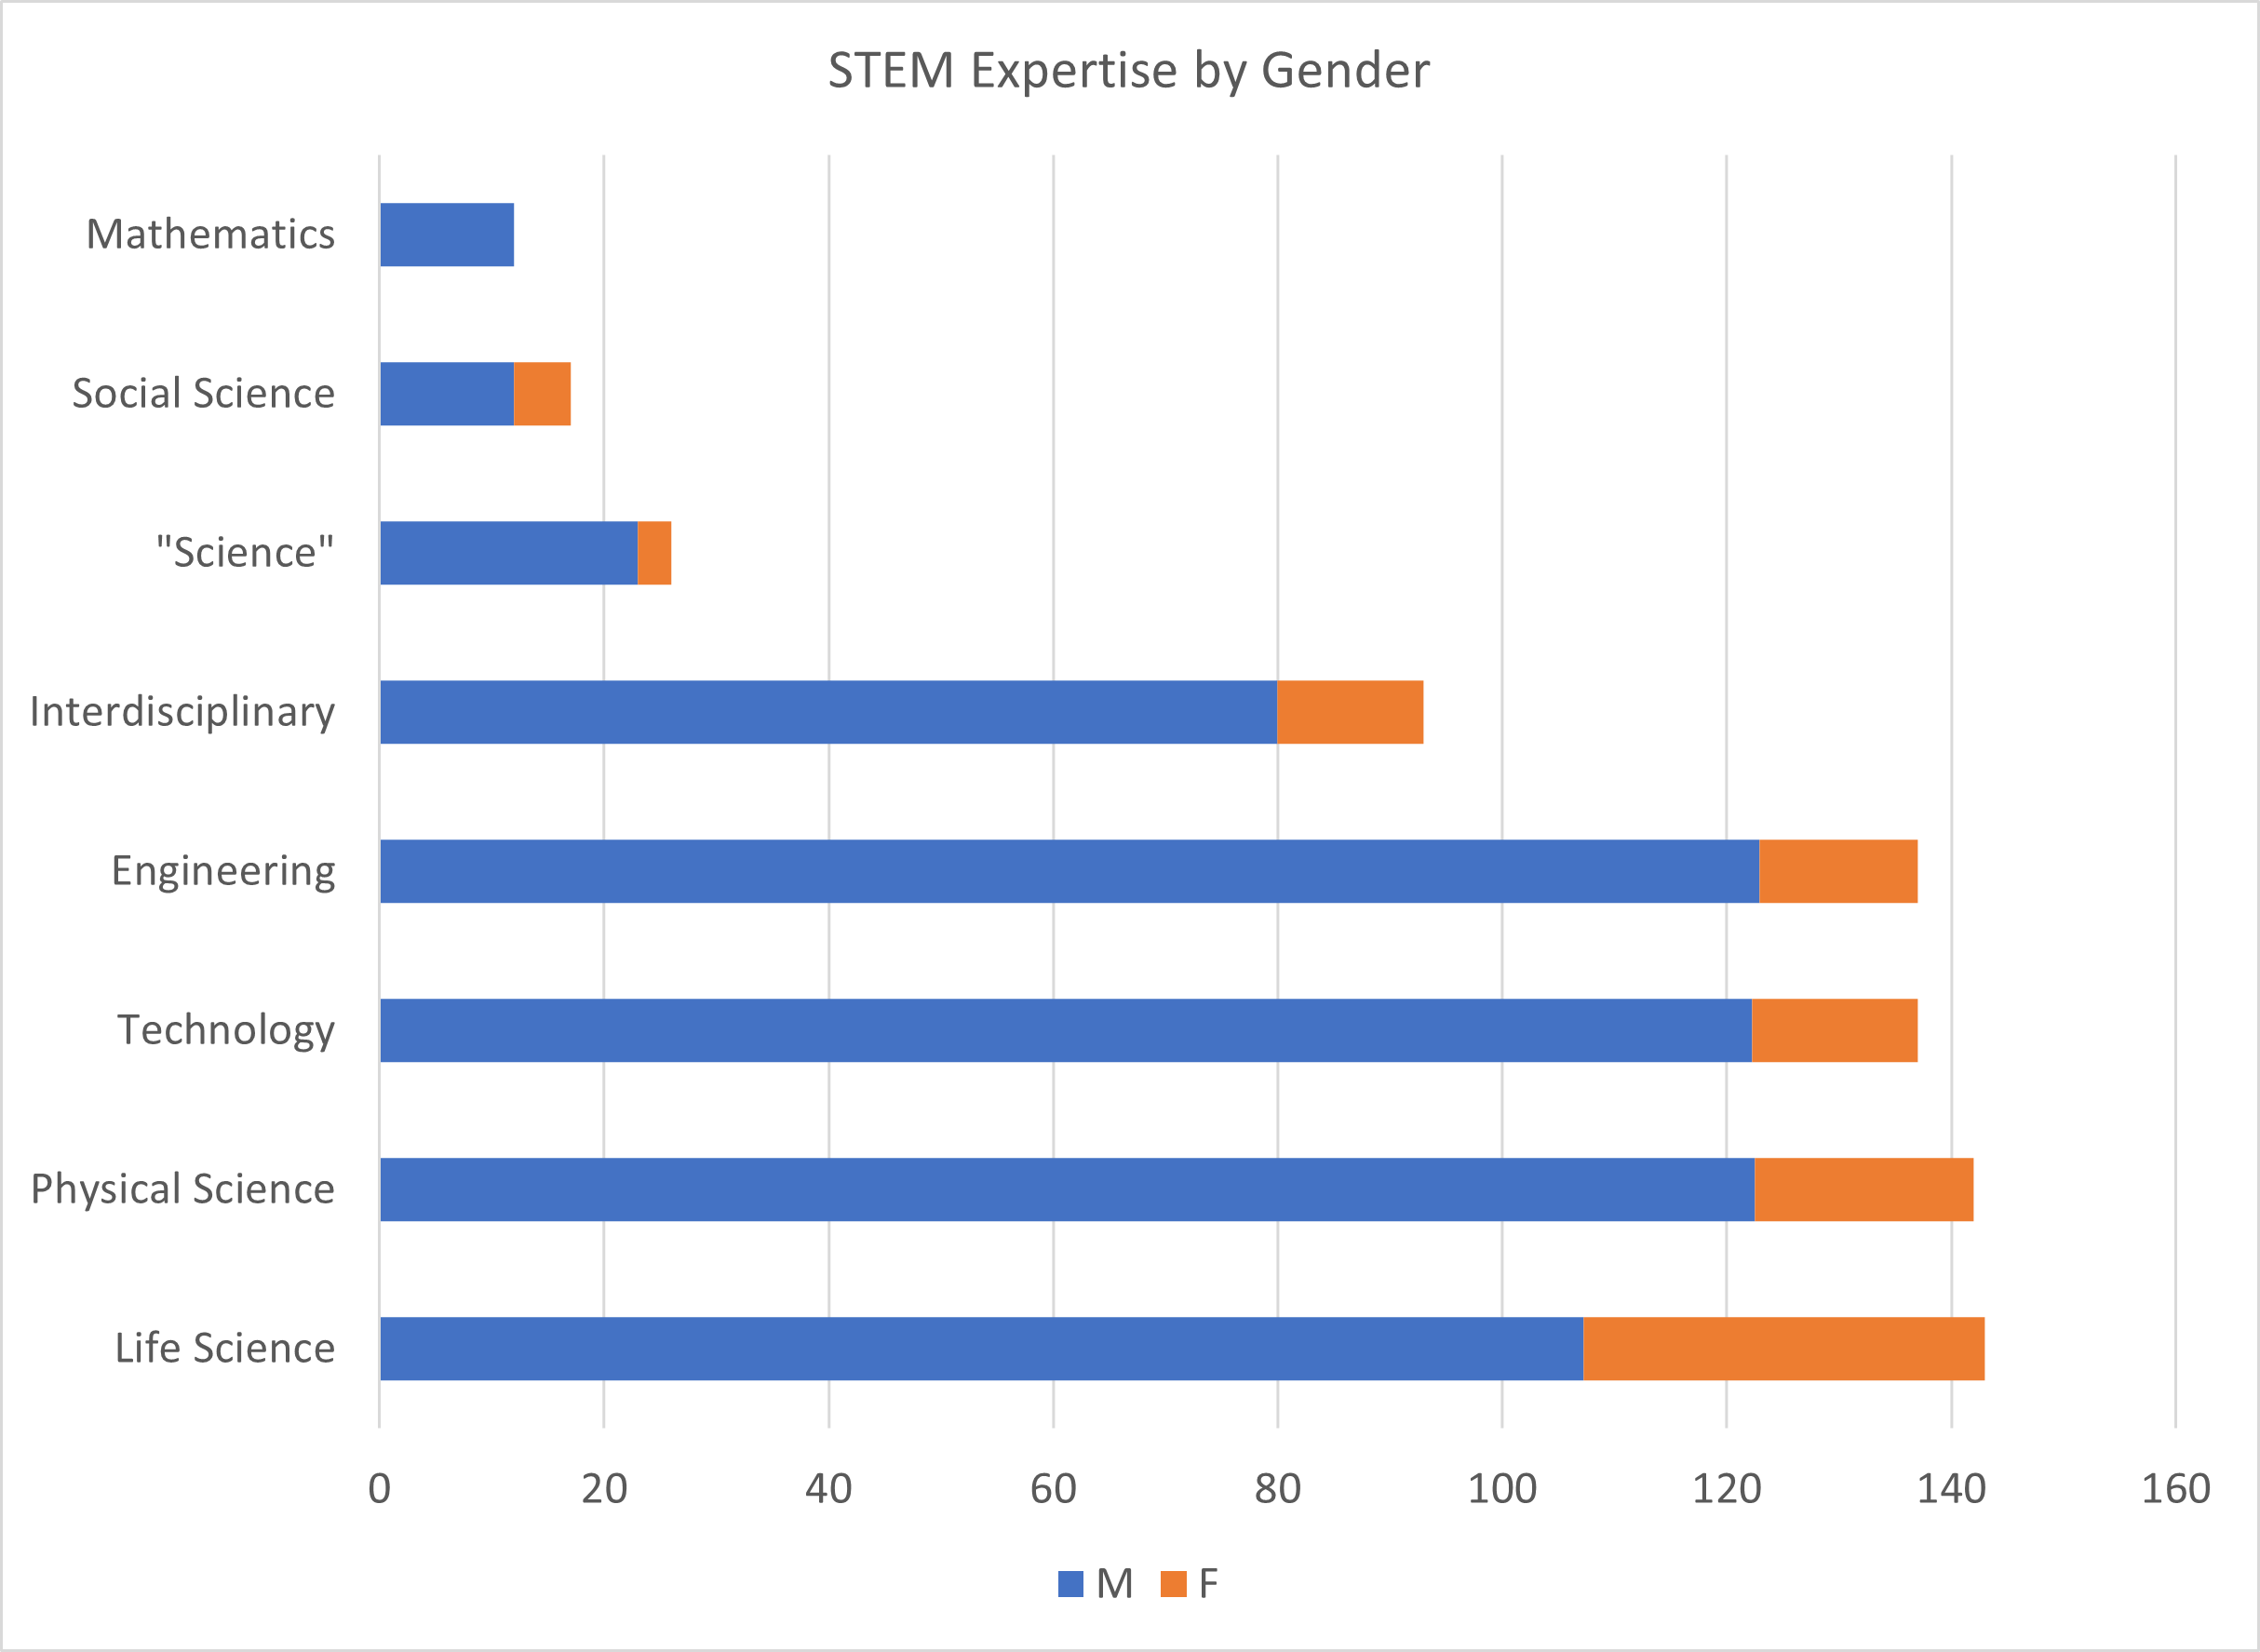
Gender distribution for different STEM fields depicted in the movies is also instructive to look at. In Figure 6, we see the great imbalance reflected in all fields. Life Sciences have the largest proportion of women, which is true in the real world as well. It is more balanced in the real world, however. The disparity in physical science matches the real world disparity in those fields. Mathematicians are purely male in these films. This reinforces the common, harmful prejudice of women not being good at math.
|
|
Figure 6: The number of characters per STEM expertise by gender.
|
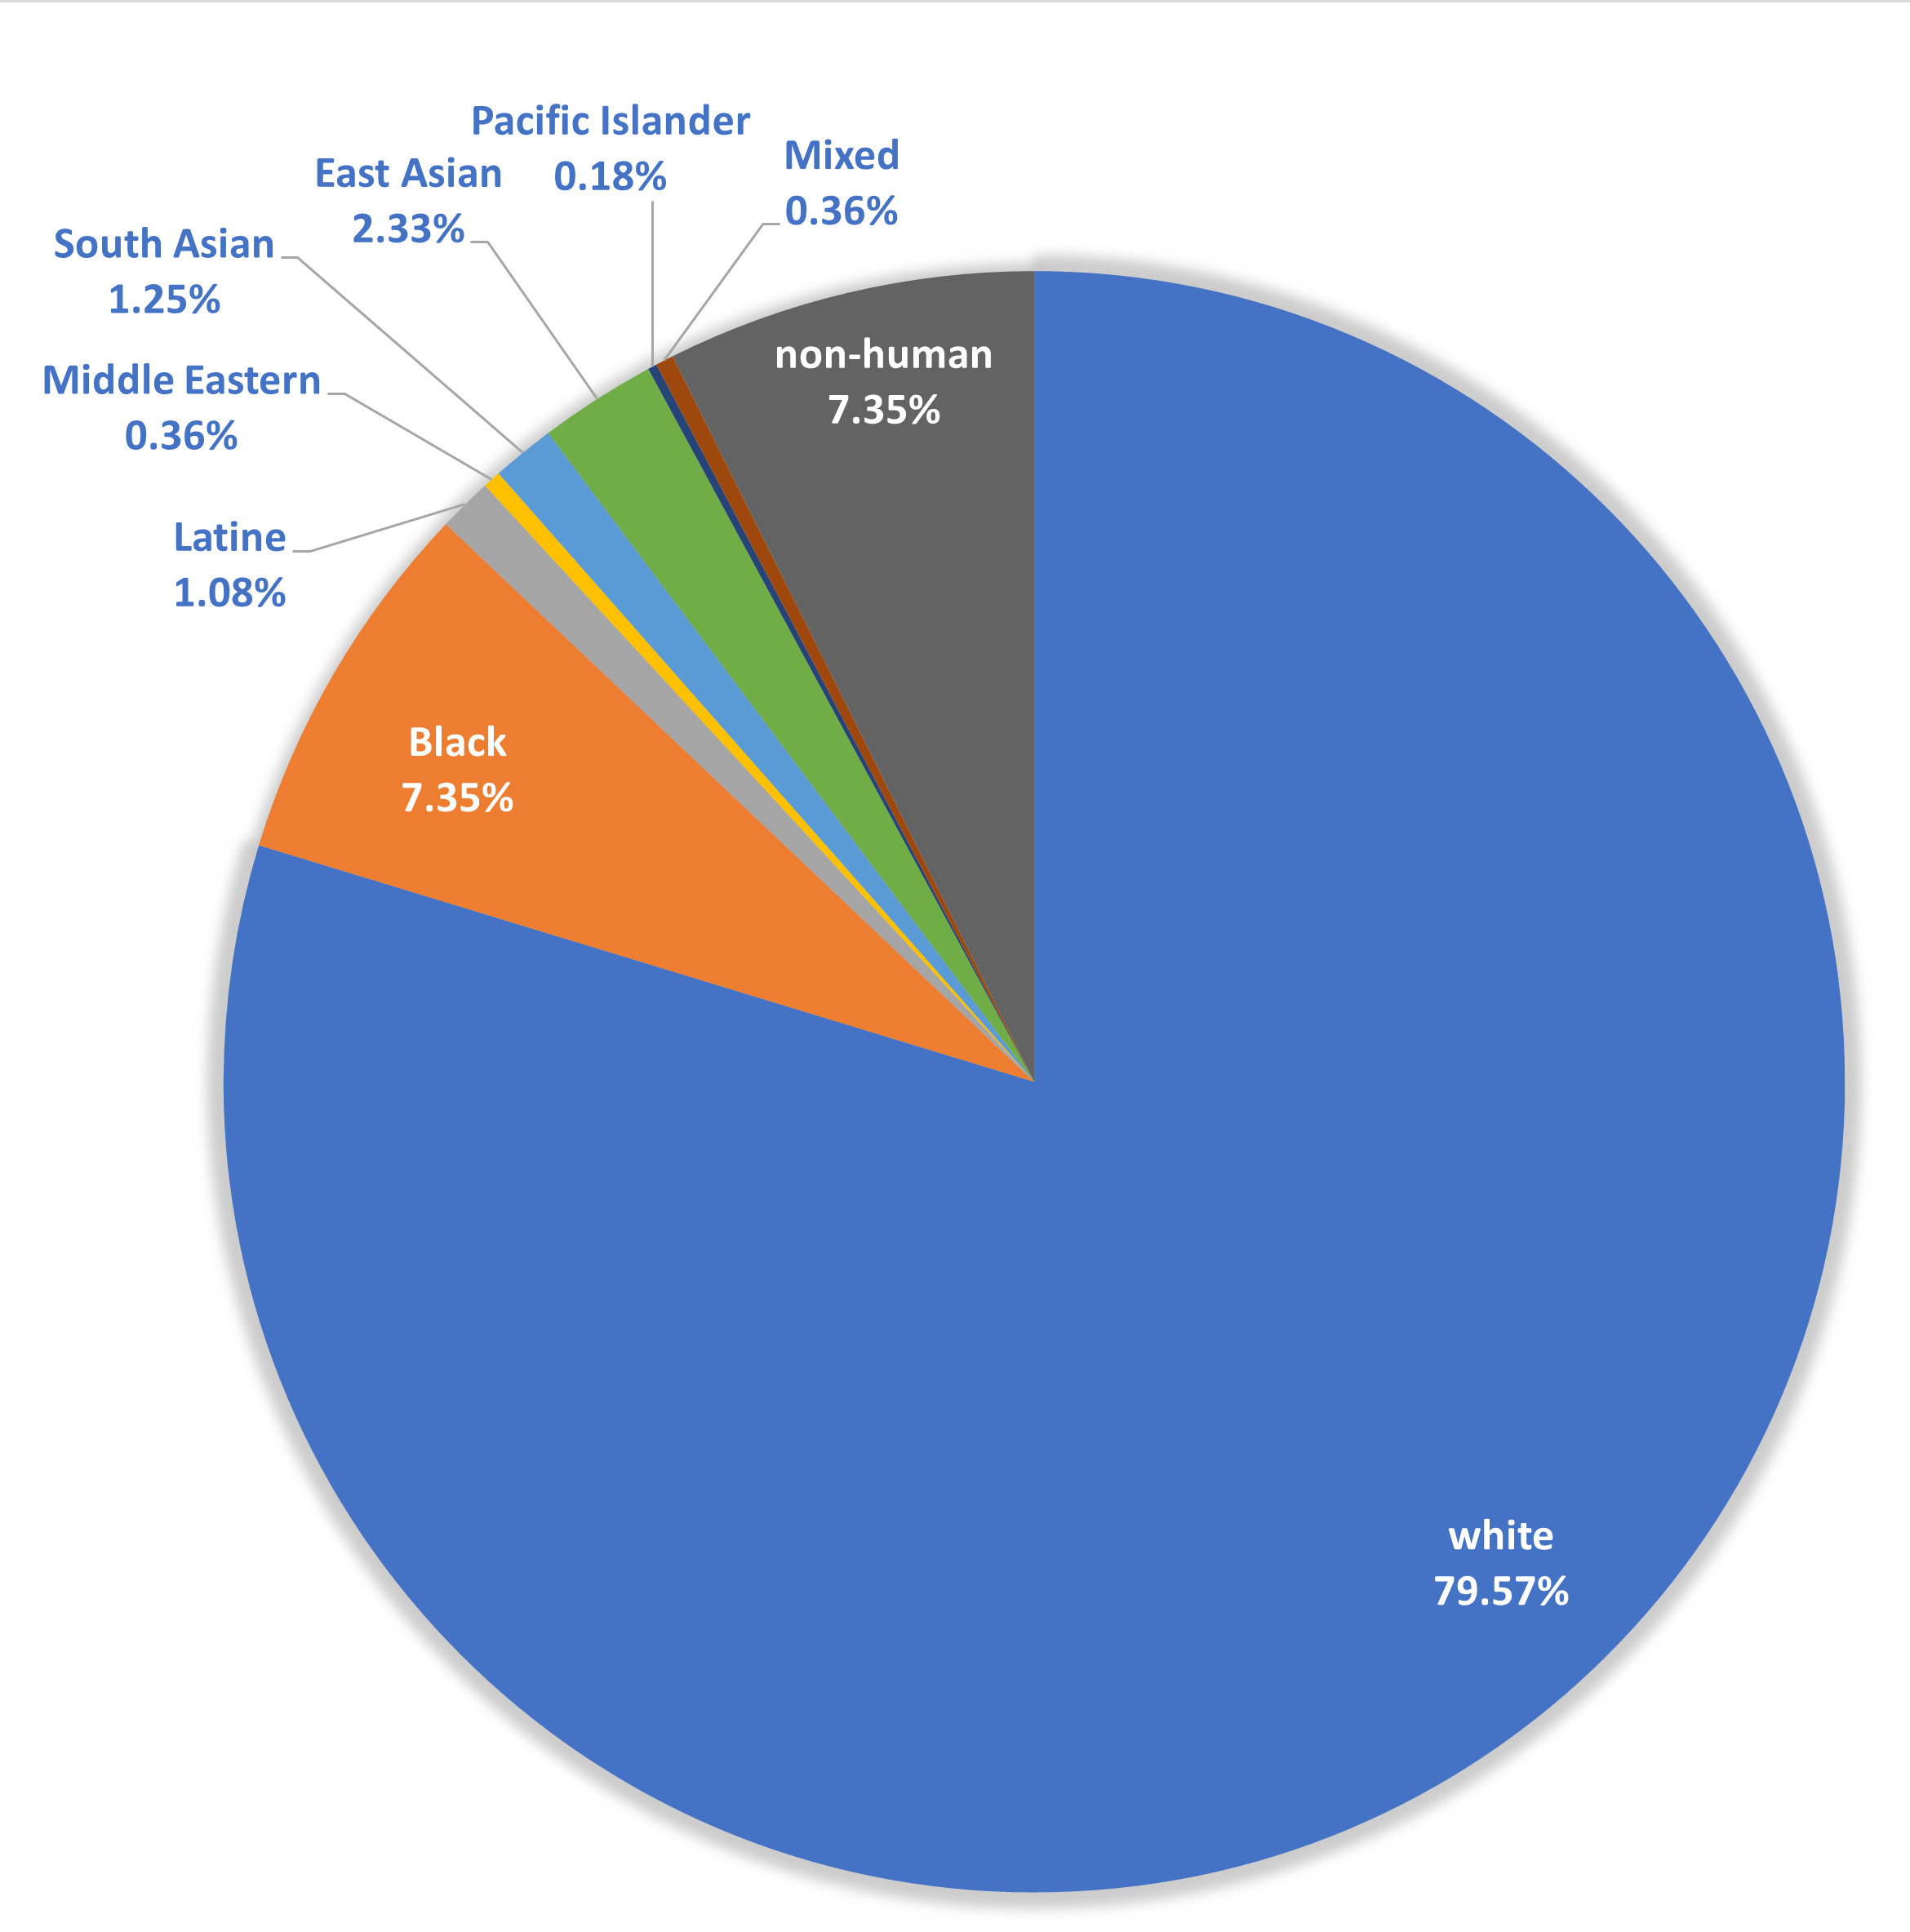
Race & Ethnicity
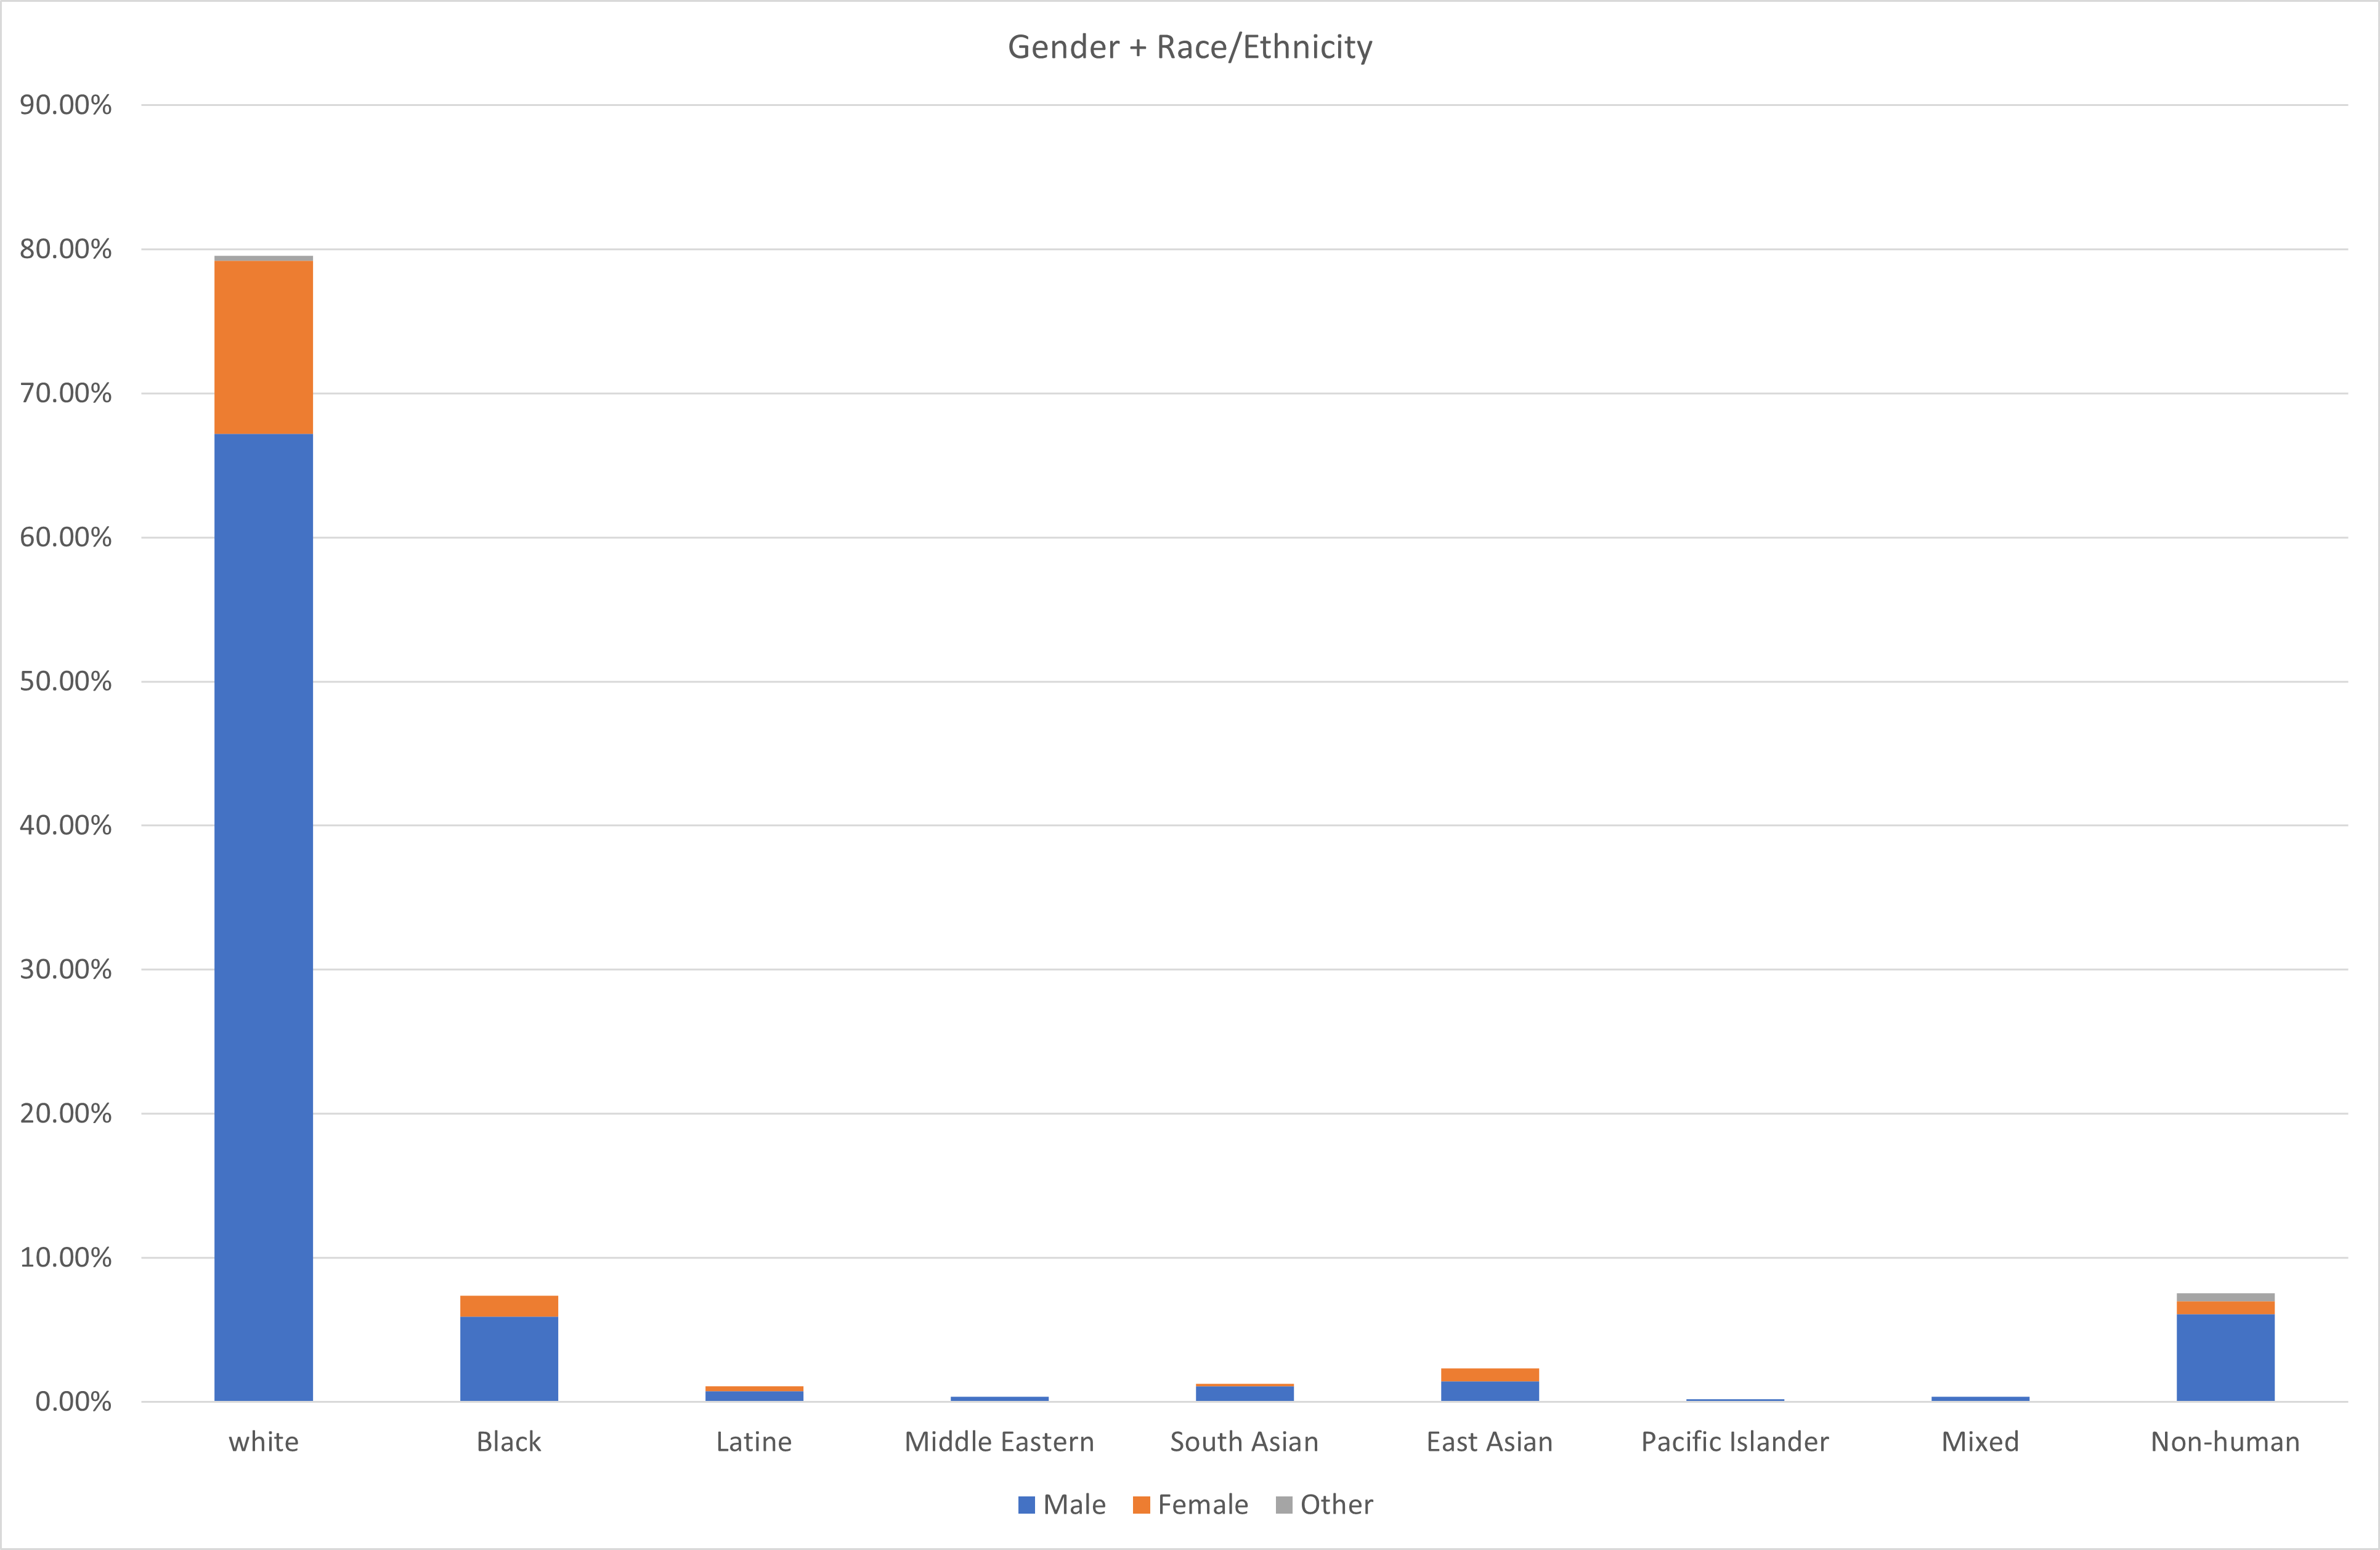
I decided to mix race and ethnicity into one category. This was done because most films lack any explicit portrayal of the characters’ race or ethnicity (or the difference between them), apart from their physical appearance. So I coded them using the race/ethnicity of the actors who portray them. As we see in Figure 7, 8 in 10 STEM characters are white. The next most common race/ethnicity is Black (7.4%) and non-human characters (7.4%, all of whom are portrayed by white actors). Next are East Asians (2.3%). South Asian characters are 1.3% while Latine** characters are only 1%. There were only 2 Middle-Eastern STEM characters, 2 characters of mixed race/ethnicity, and 1 Pacific Islander (there are no other Indigenous ethnicities portrayed).
**I chose to use Latine over Latinx simply out of personal preference. It’s easy to pronounce and fits with the style of Latin languages. It isn’t used much in the United States (where Latinx has become dominant), but it is used in many Central American countries.
|
|
Figure 7: The relative proportion of STEM character by race/ethnicity.
|
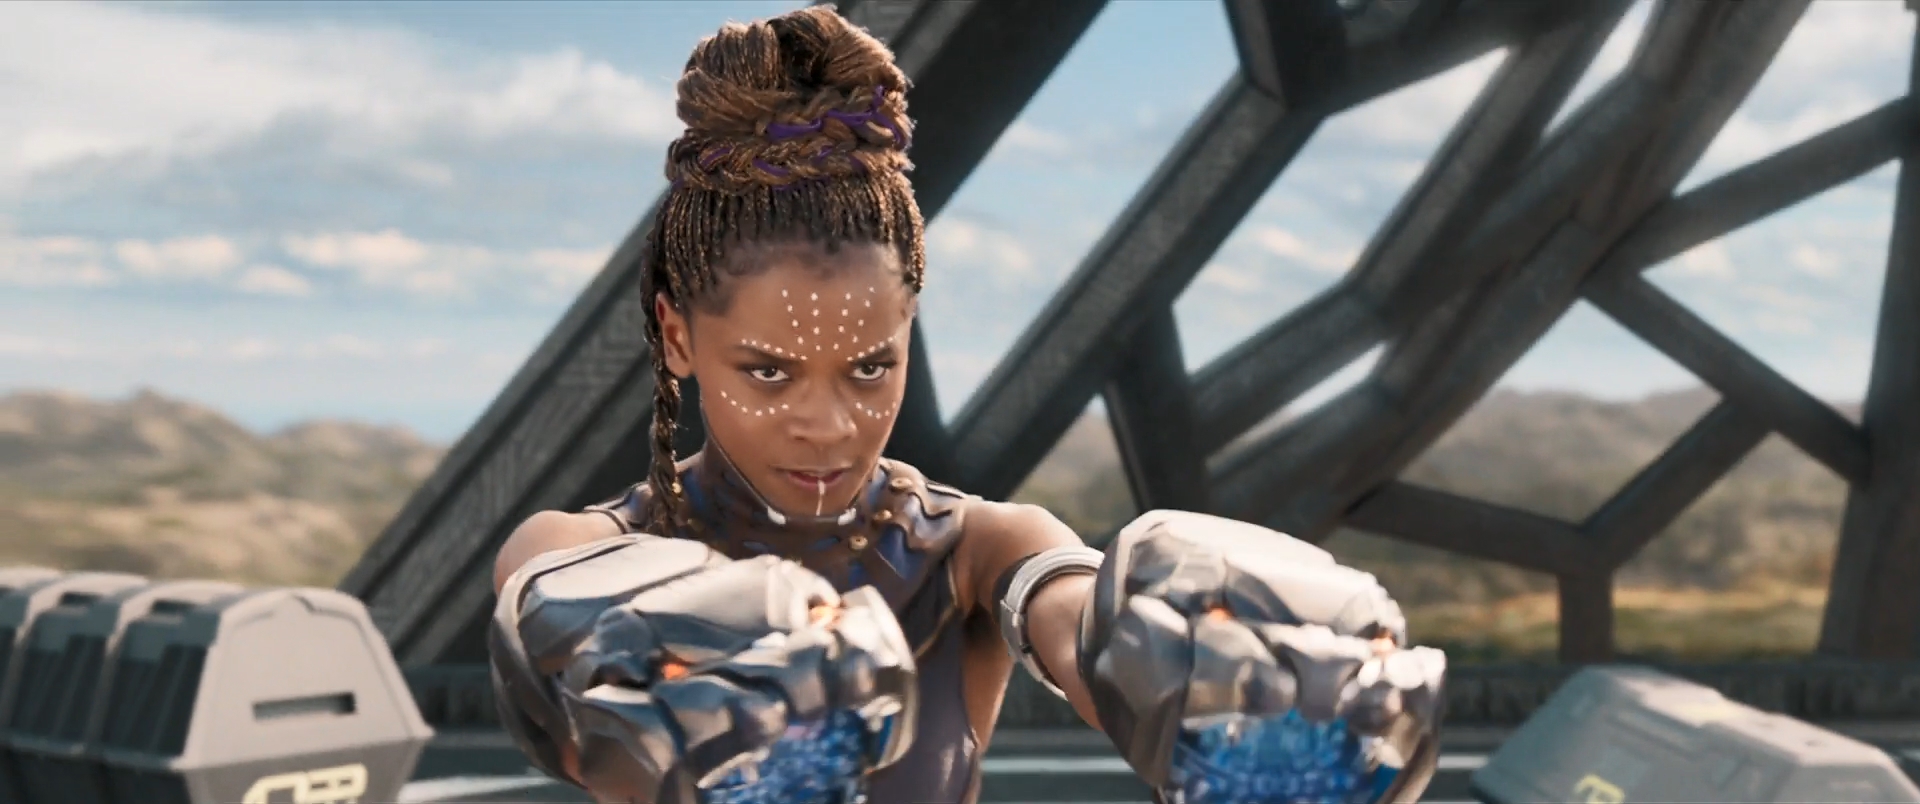
It’s important to note that STEM characters of color are treated in a mostly “color blind” manner, as if their race/ethnicity had no bearing on who they are. The Black characters where their race/ethnicity is even acknowledged and matters to their character is easy to count: Shuri (Black Panther) is one of the few. This is also harmful for building STEM identity in underrepresented people. Color blindness may purport to be a philosophy that success does not depend on race/ethnicity and that if everyone is treated equally then they all have an equal chance at success. But this ignores reality. People are in fact different because of race and ethnicity. I don’t mean in any intellectual or physical way. But different races and ethnicities (especially in the U.S.) have different philosophies and experiences of life. White supremacy and racism have worked to keep underrepresented people underrepresented in fields like STEM. Writing a character who is Black, but ignoring the reality of being Black in the U.S., is unrealistic. The harm comes especially when the underrepresented character is portrayed in the color blind manner, because color blindness pretends that there is some default/popular culture that is neutral. But there isn’t. Color blindness treats whiteness as default. A Black STEM character portrayed in this color blind way could be played by an actor of any race and not one change in the script would be needed. That’s treating whiteness as default and sending the message that if you want to join the ranks of the STEM professionals, then you need to abandon the cultural values you were raised with and assimilate into white culture.
|
|
Shuri, Black Panther (2018), is the one of the only Black STEM characters in the data whose race/ethnicity were important to her character.
|
Filmmakers need to do better here. They need to create underrepresented STEM characters who bring their whole selves to their work.
Before looking at other dimensions of diversity, it’s instructive to ask if the gender disparity seen generally is also true when broken down by race/ethnicity.
|
|
Figure 8: The number of STEM characters by race/ethnicity and gender.
|
Figure 8 shows the combined data for gender and ethnicity. It shows that the gender disparity is strong in all ethnicities. East Asian characters are the closest to gender parity. It also shows that the race/ethnicity disparity exists for both genders in similar proportions. Compared to their proportion of the U.S. population Latine characters (especially Latinas) are the most severely under-represented in popular films (Latines make up 18.3% of the current U.S. population by census bureau estimates).
Sexual Orientation
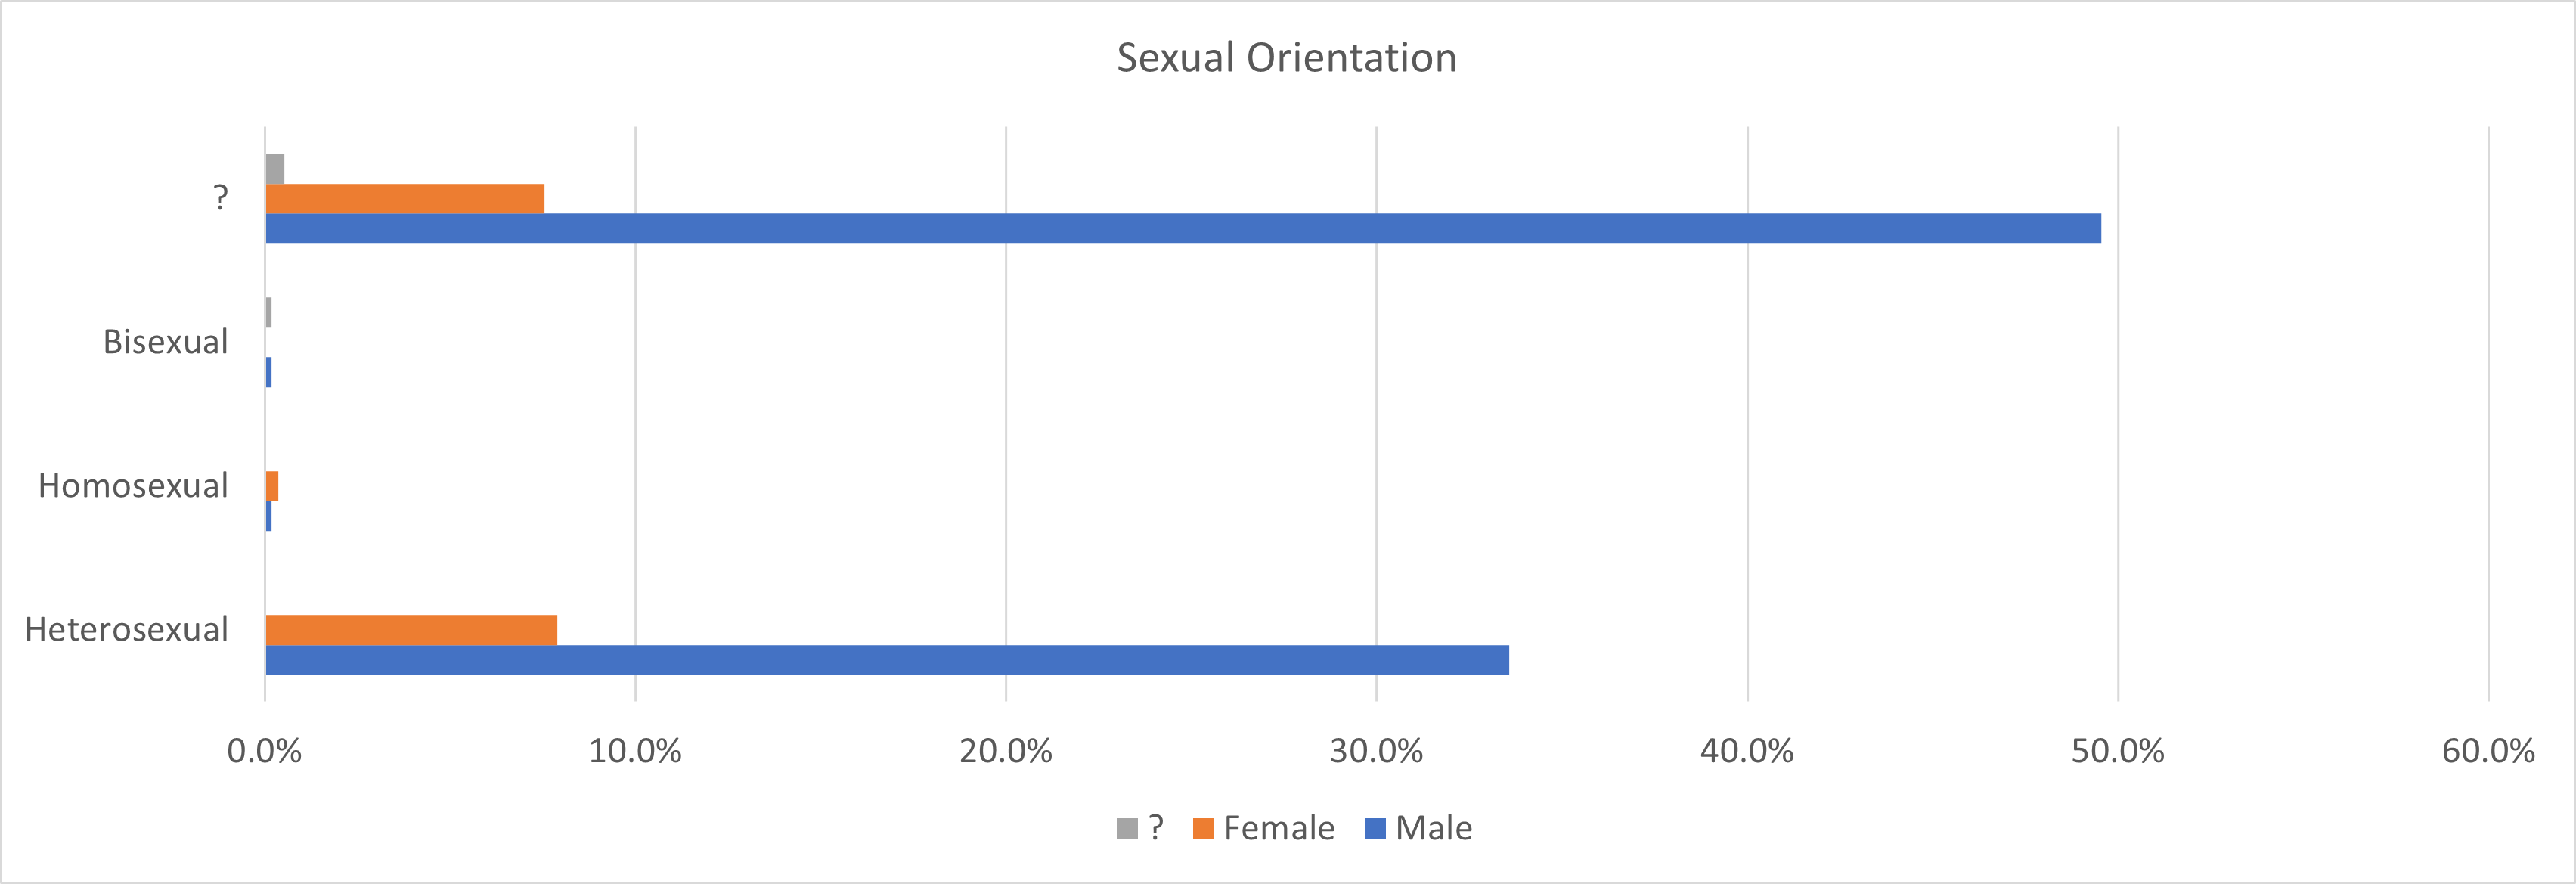
Sexual Orientation is not a primary trait for most STEM characters in popular films. For the vast majority of STEM characters their sexual orientation does not play into their story or portrayal. I therefore only coded characters with a definitive orientation if it is made explicit in the film. Sometimes I was able to make a determination based on subtext, such as the character being married or in a relationship with someone of the opposite gender (though in real life that has not historically been a definitive indicator). More often than not, I simply coded them as ‘?’, meaning unknown to the audience (rather than unknown to the character). For those with known sexual orientation, heterosexuality is disproportionately represented by a margin of about 5:1 (recent polls show about 4.5% of American adults identify as LGBTQ). See Figure 9.
|
|
Figure 9: The number of STEM characters by sexual orientation and gender.
|
Examining the sexual orientation of only the main characters, we see similar proportions as all of the characters. Something worth noting is that we do not know the sexuality of 61% of the male characters compared to 46% of the female characters. We are more likely to know a woman's sexuality than a man's. This speaks to a kind of sexism that has been well documented in female portrayals of professionals in film: for men to accept a woman in science she should be depicted as sexually desirable.
Disability
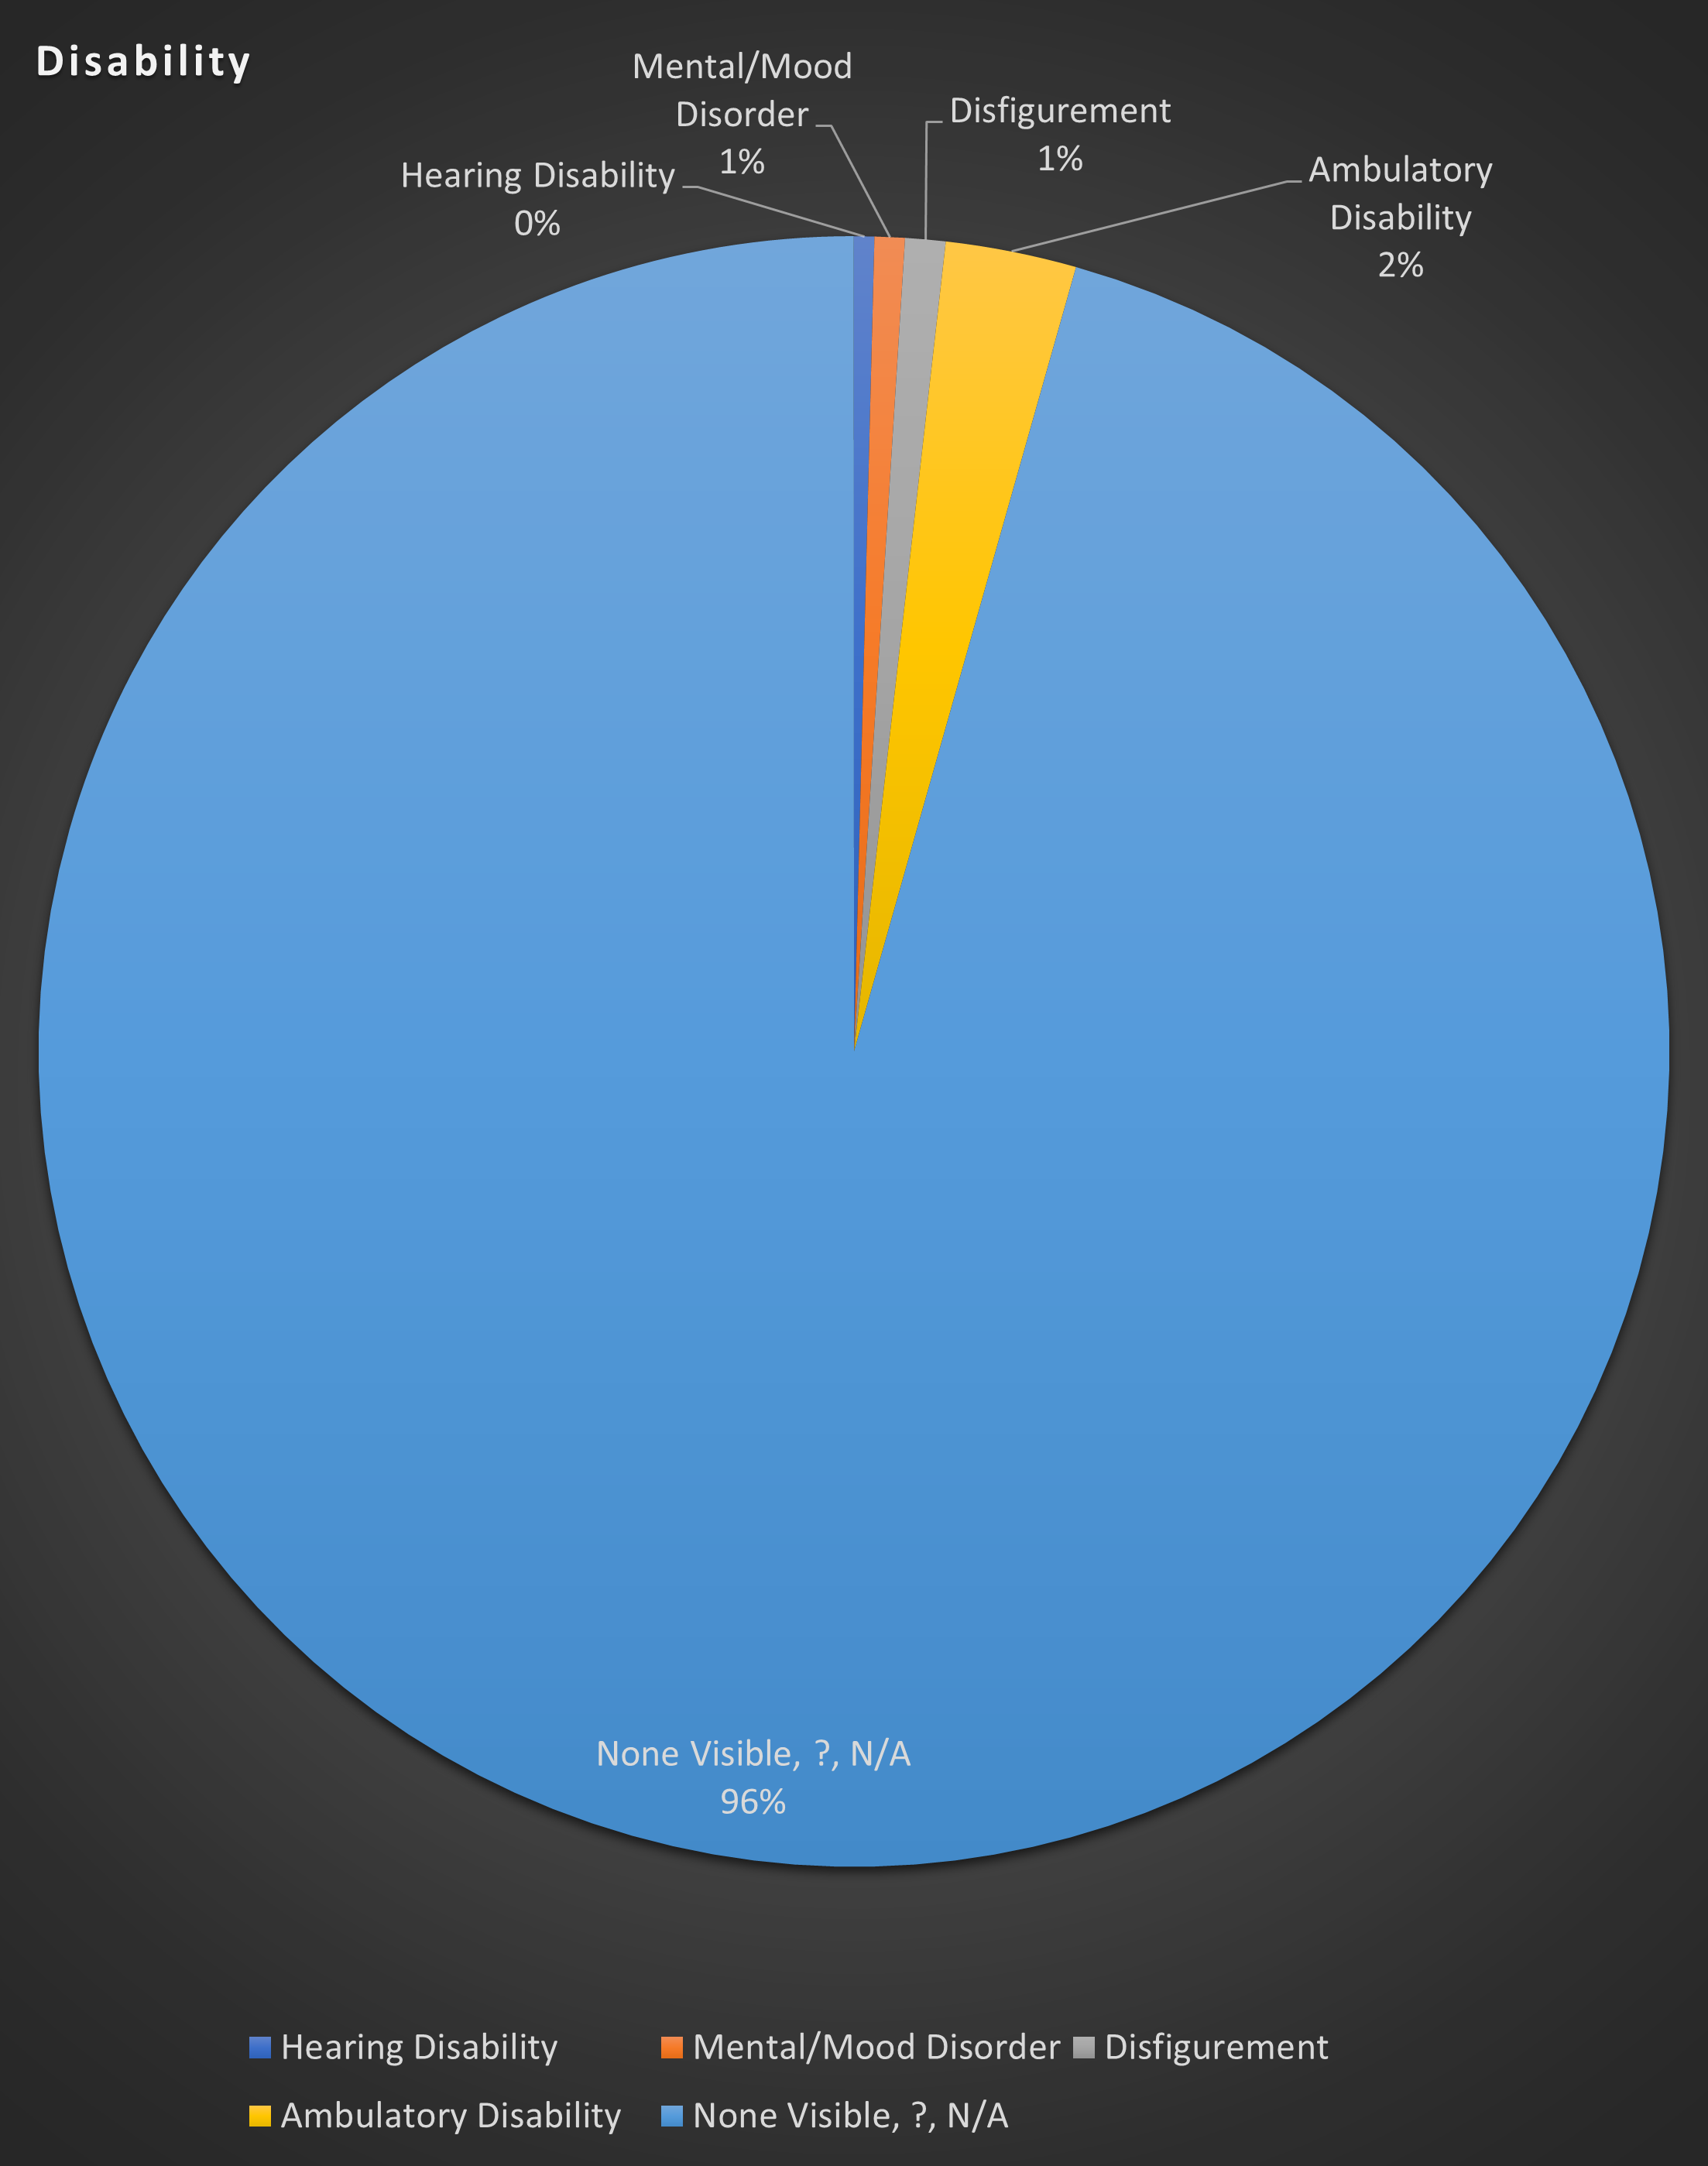
I also attempted to measure the representation of disability for the characters in the survey. We see in Figure 10 that the overwhelming number have no visible disability. I had to make this judgement based on appearance, because invisible disability (physical and mental) was not often an explicit trait of the characters. In about 10 cases I felt such a snap decision couldn’t be made.
|
|
Figure 10: The proportions of STEM characters by disability.
|
For the mere 22 characters with any kind of explicit disability, ambulatory disabilities were the most common (amputations, paraplegia, and limps).
It’s worth noting that several of those characters had compensating cybernetic enhancements that gave them better than normal ability.
One character depicted as wheel-chair bound may in fact be able, but was hiding the fact that he liked to wear women’s hosiery.
Three characters had some kind of mental or mood disability. One is the Joker (Batman, 1989) whose disorder is played as a reason for his cruelty. Another, D.O. Guerrero (Airport, 1970) is depicted as having a mental disorder that has made him suicidal, with devastating effects. The third was based on a real person, mathematician John Nash, who suffers from schizophrenia (A Beautiful Man, 2001). Depictions of mental disorders as motivations for malicious acts tends to create/reinforce harmful prejudices about such conditions.
Good Guys vs. Bad Guys
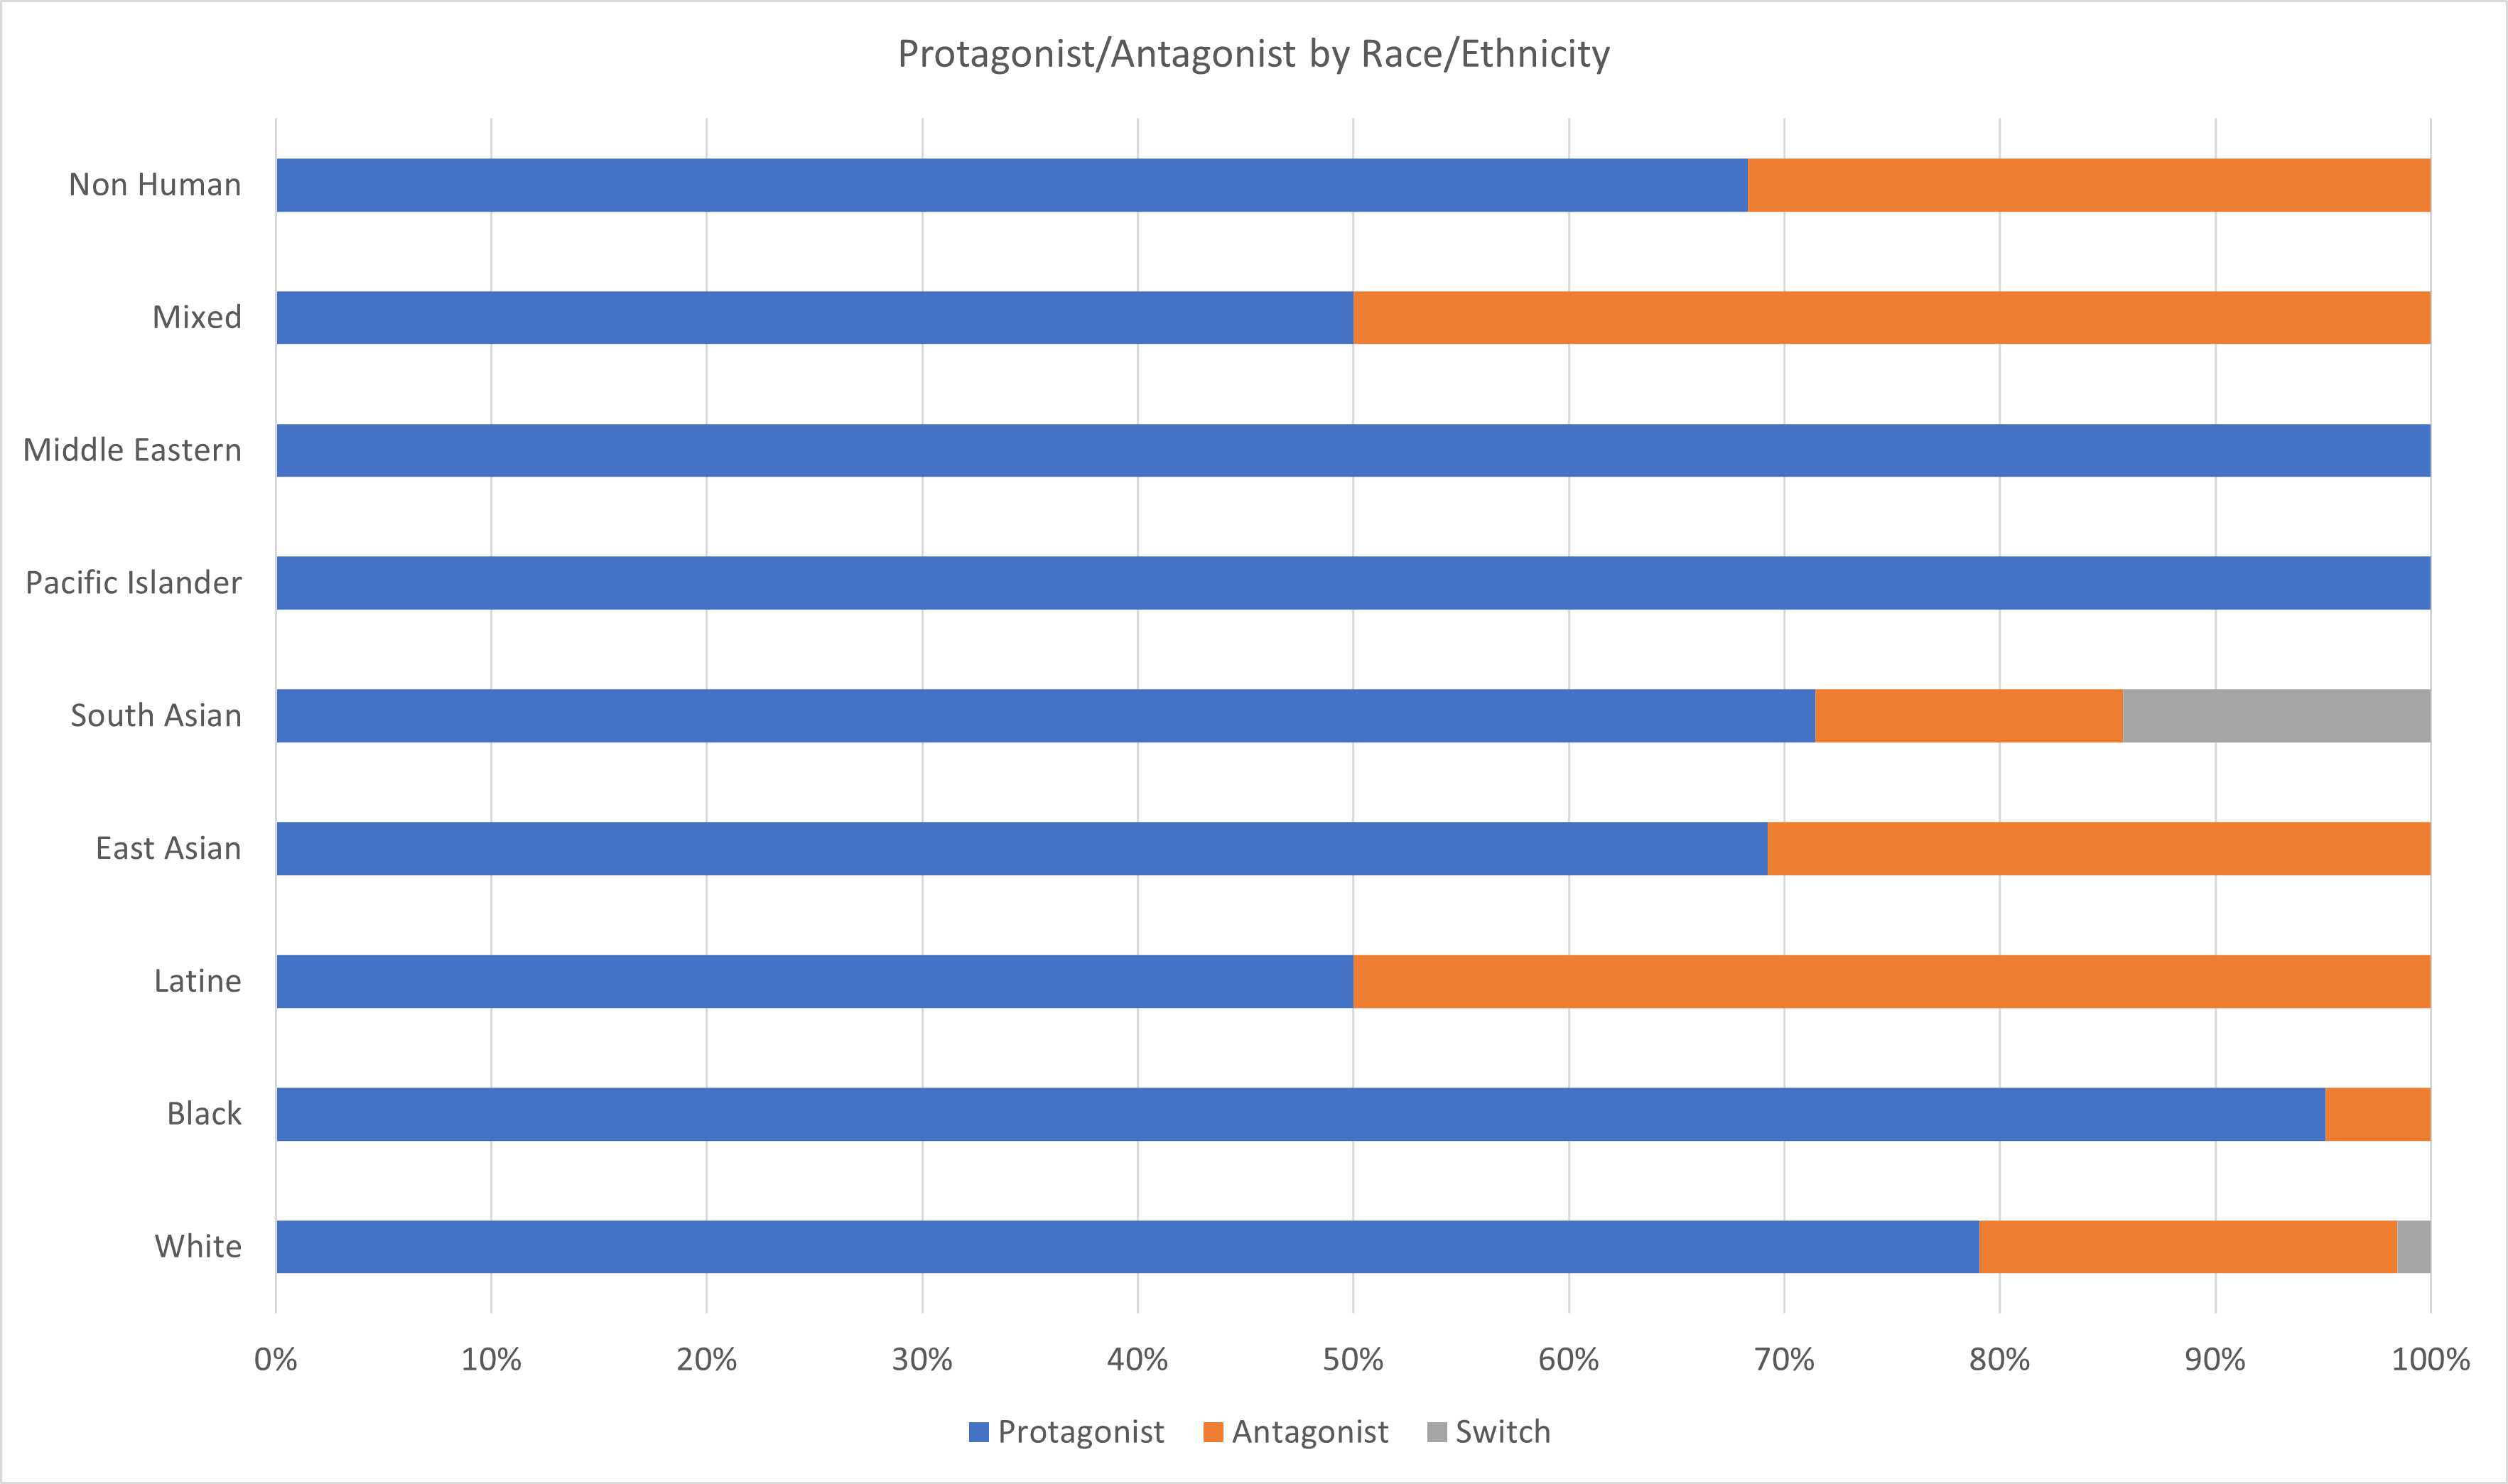
Despite my expectation that the “mad scientist” trope would be very common, among the most popular films, protagonist STEM characters outnumbered the antagonists:
- 20% Antagonist
-
79% Protagonist
-
1% Switch Allegiance
Protagonists outnumber antagonists for every race/ethnicity (Figure 11). However, the numbers of Latine, mixed, Middle-Eastern, and Pacific Islander characters are too small for any statistically significant comparison.
|
|
Figure 11: The number of protagonist verses antagonist STEM characters by gender.
|
This at least tells us that the “mad scientist” trope is not as common as the collective consciousness would tend to think. But, it does make you wonder why some tropes are so strong that they leave impressions far greater than more common depictions.
Diversity Trends
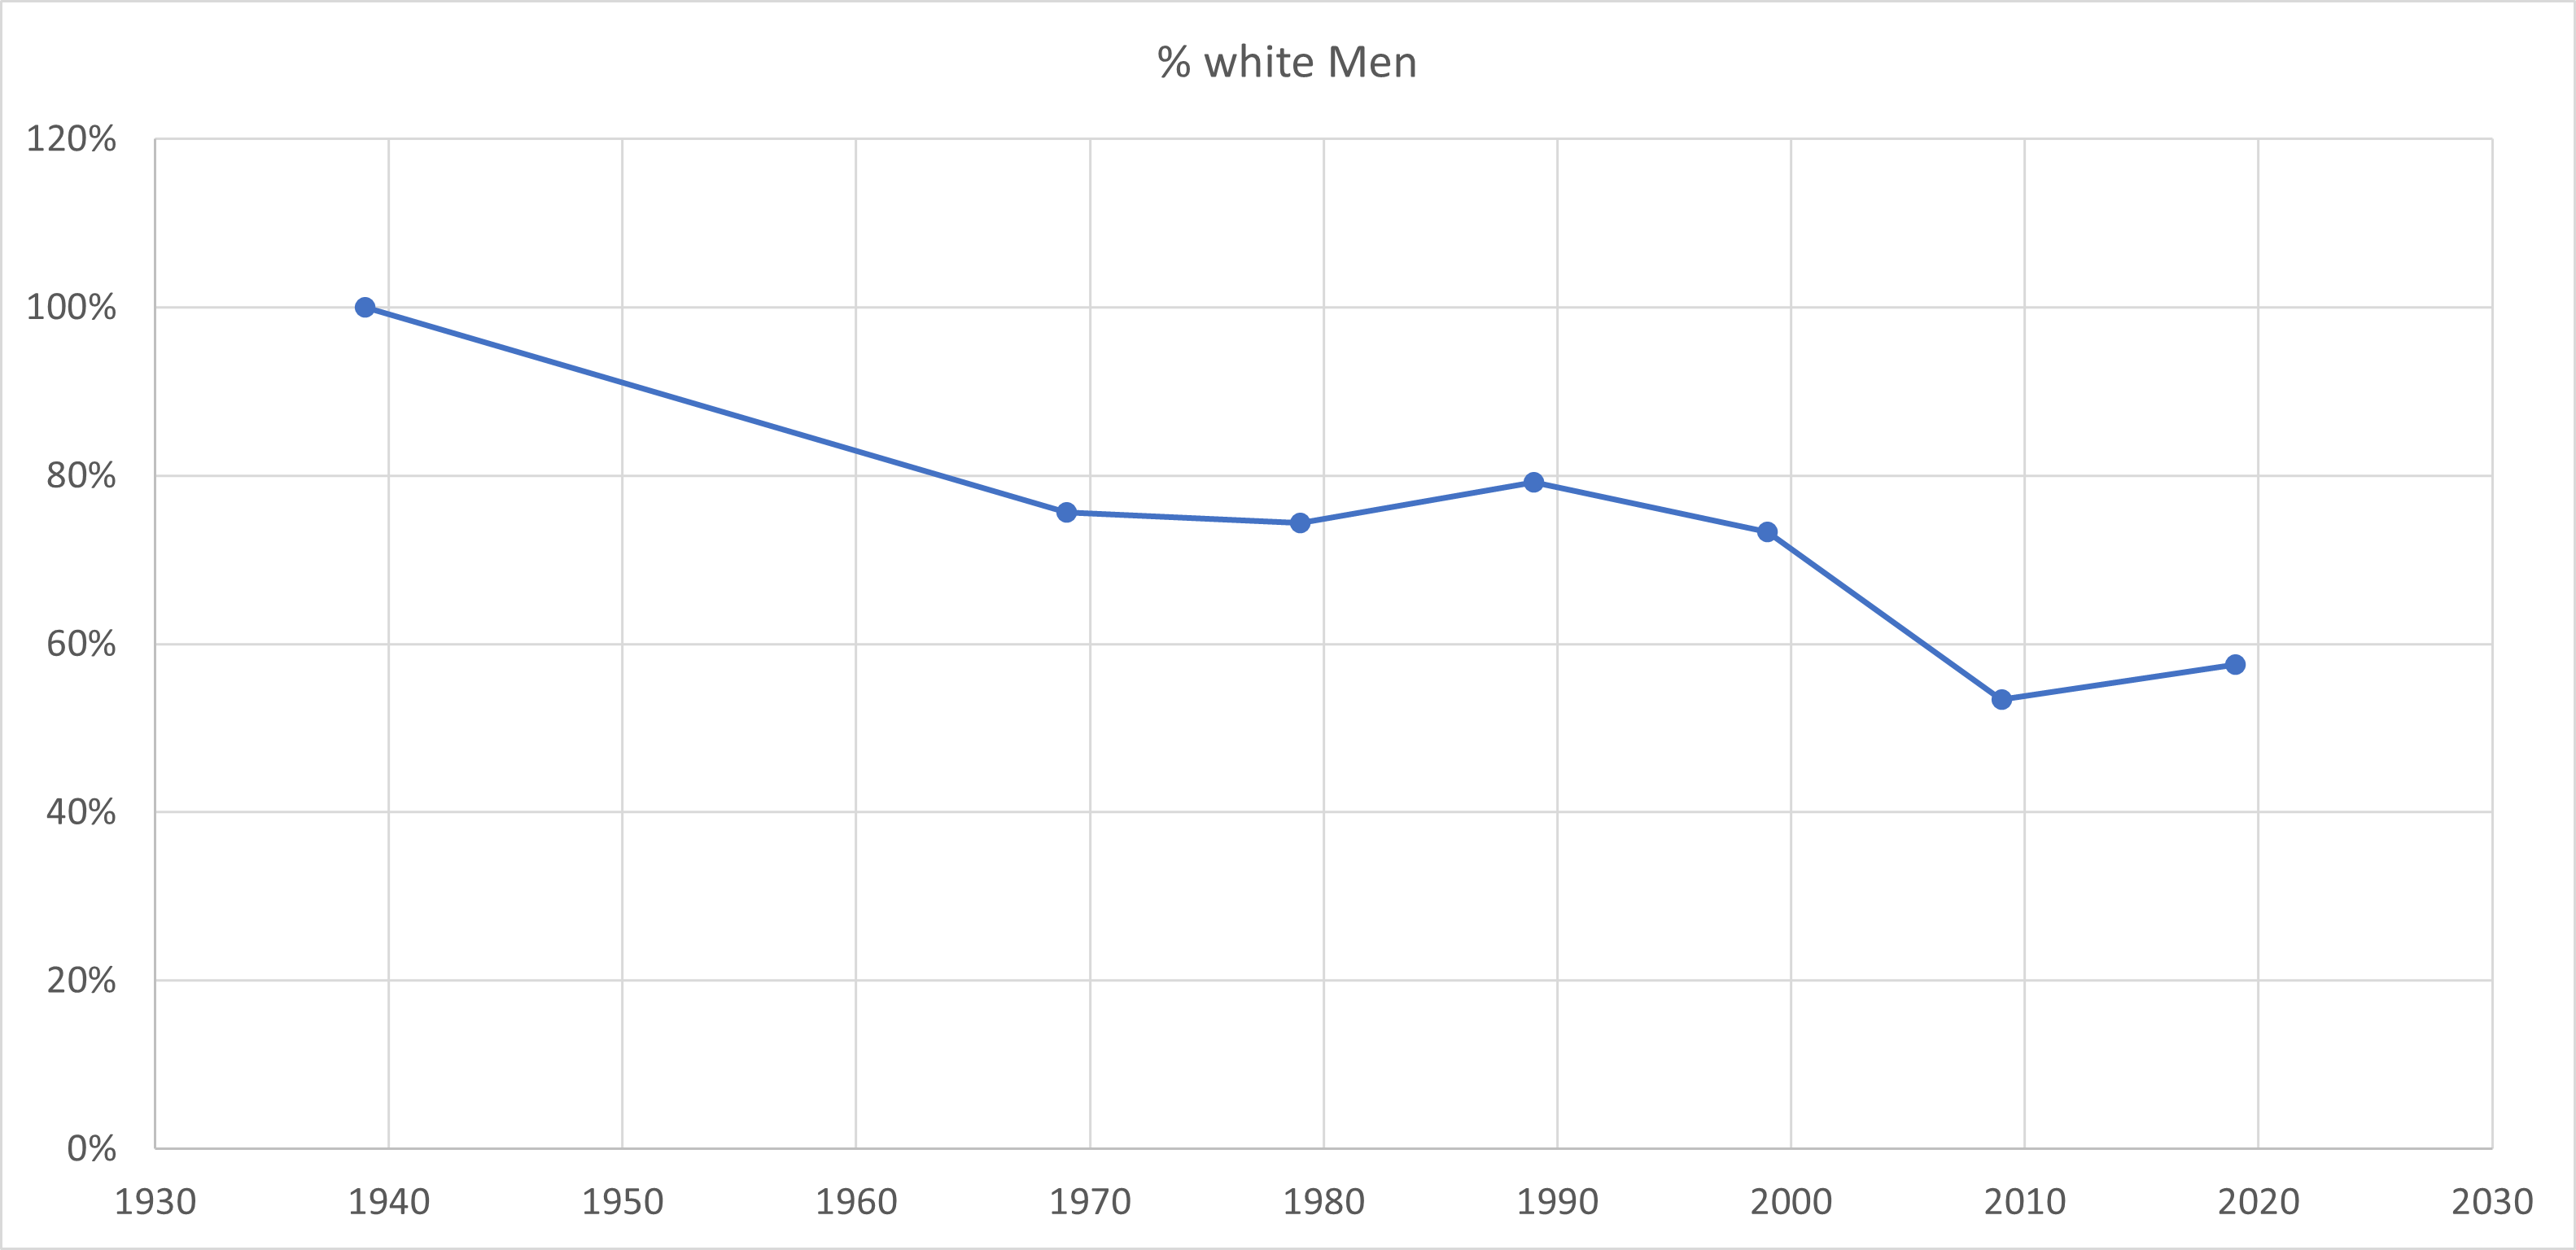
Comparing the number of white men in each decade shows that their representation is declining, reaching 58% of all STEM characters in the last 10 years of films (Figure 12). This is still over-representation, given that white men make up about 30% of the U.S. population.
|
|
Figure 12: The proportion of white, male STEM characters per decade.
|
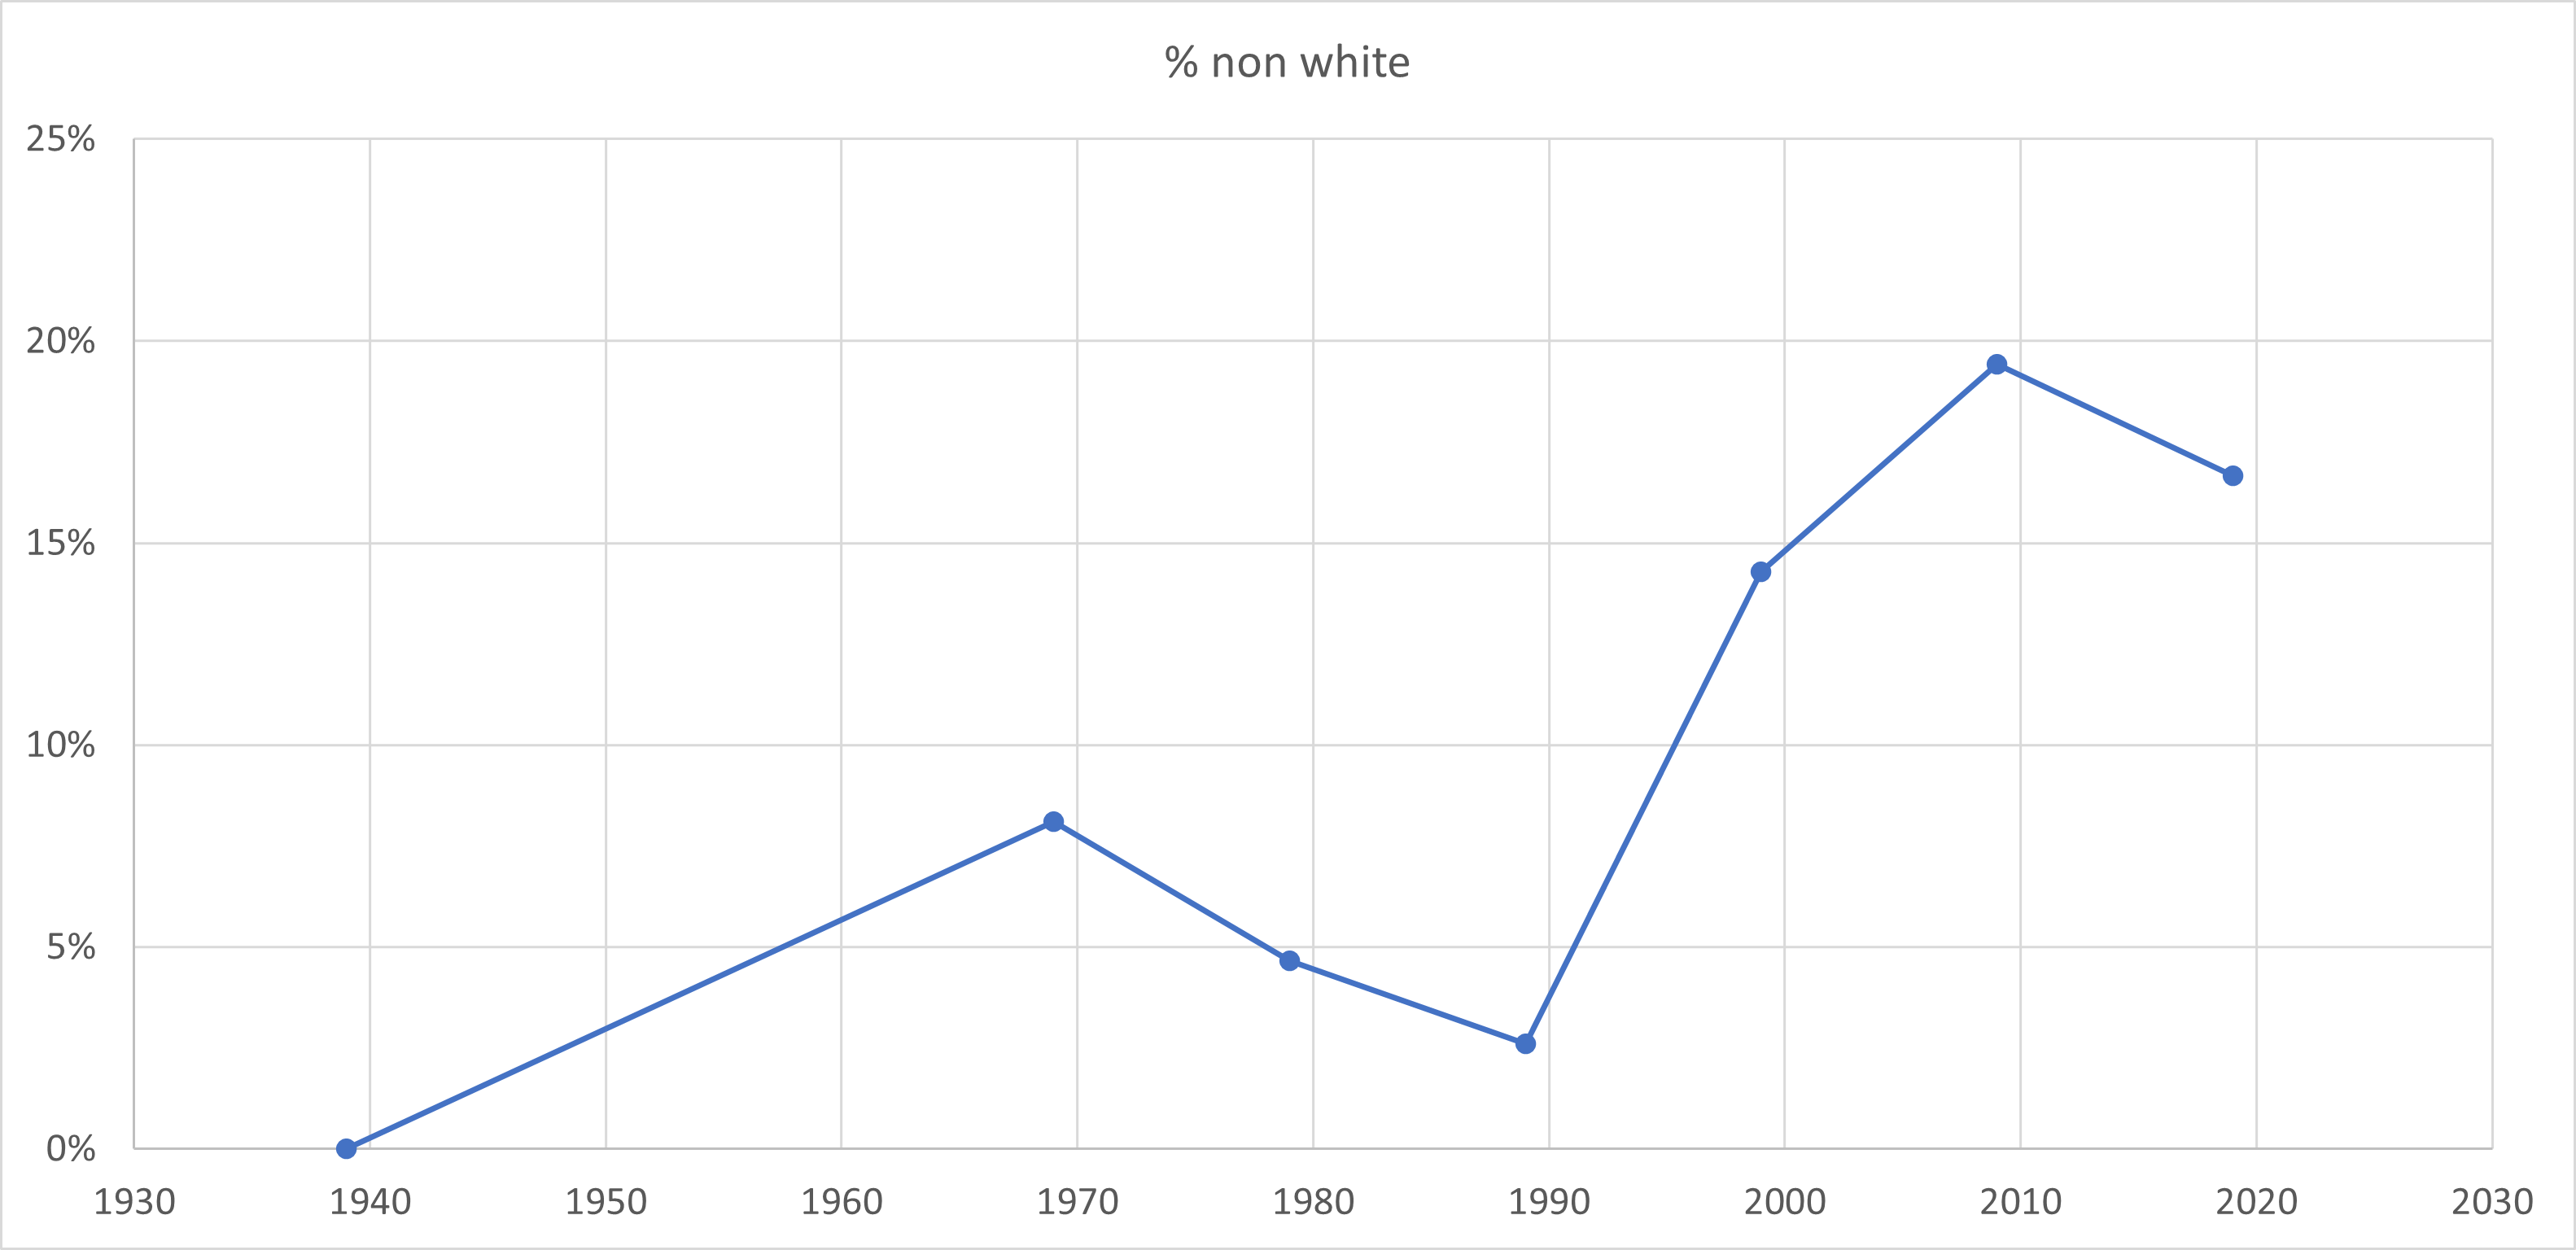
Conversely, the number of non-white STEM characters (male and female) has been increasing with time (Figure 13). It is at 17% for the current decade. Non-Hispanic whites are currently 60% of the U.S. population, so this is under-represented by more than half. Non-white representation has actually dropped from a high of 19% in the 2000s. There was a similar dip in representation in the 70s and 80s. Progress is not steady. Without a conscious effort to increase the diversity of STEM characters, I expect progress will continue to be slow and meandering.
|
|
Figure 13: The proportion of non-white STEM characters per decade.
|
The Movies vs. The Real World
But this is just the movies. The movies are not real.
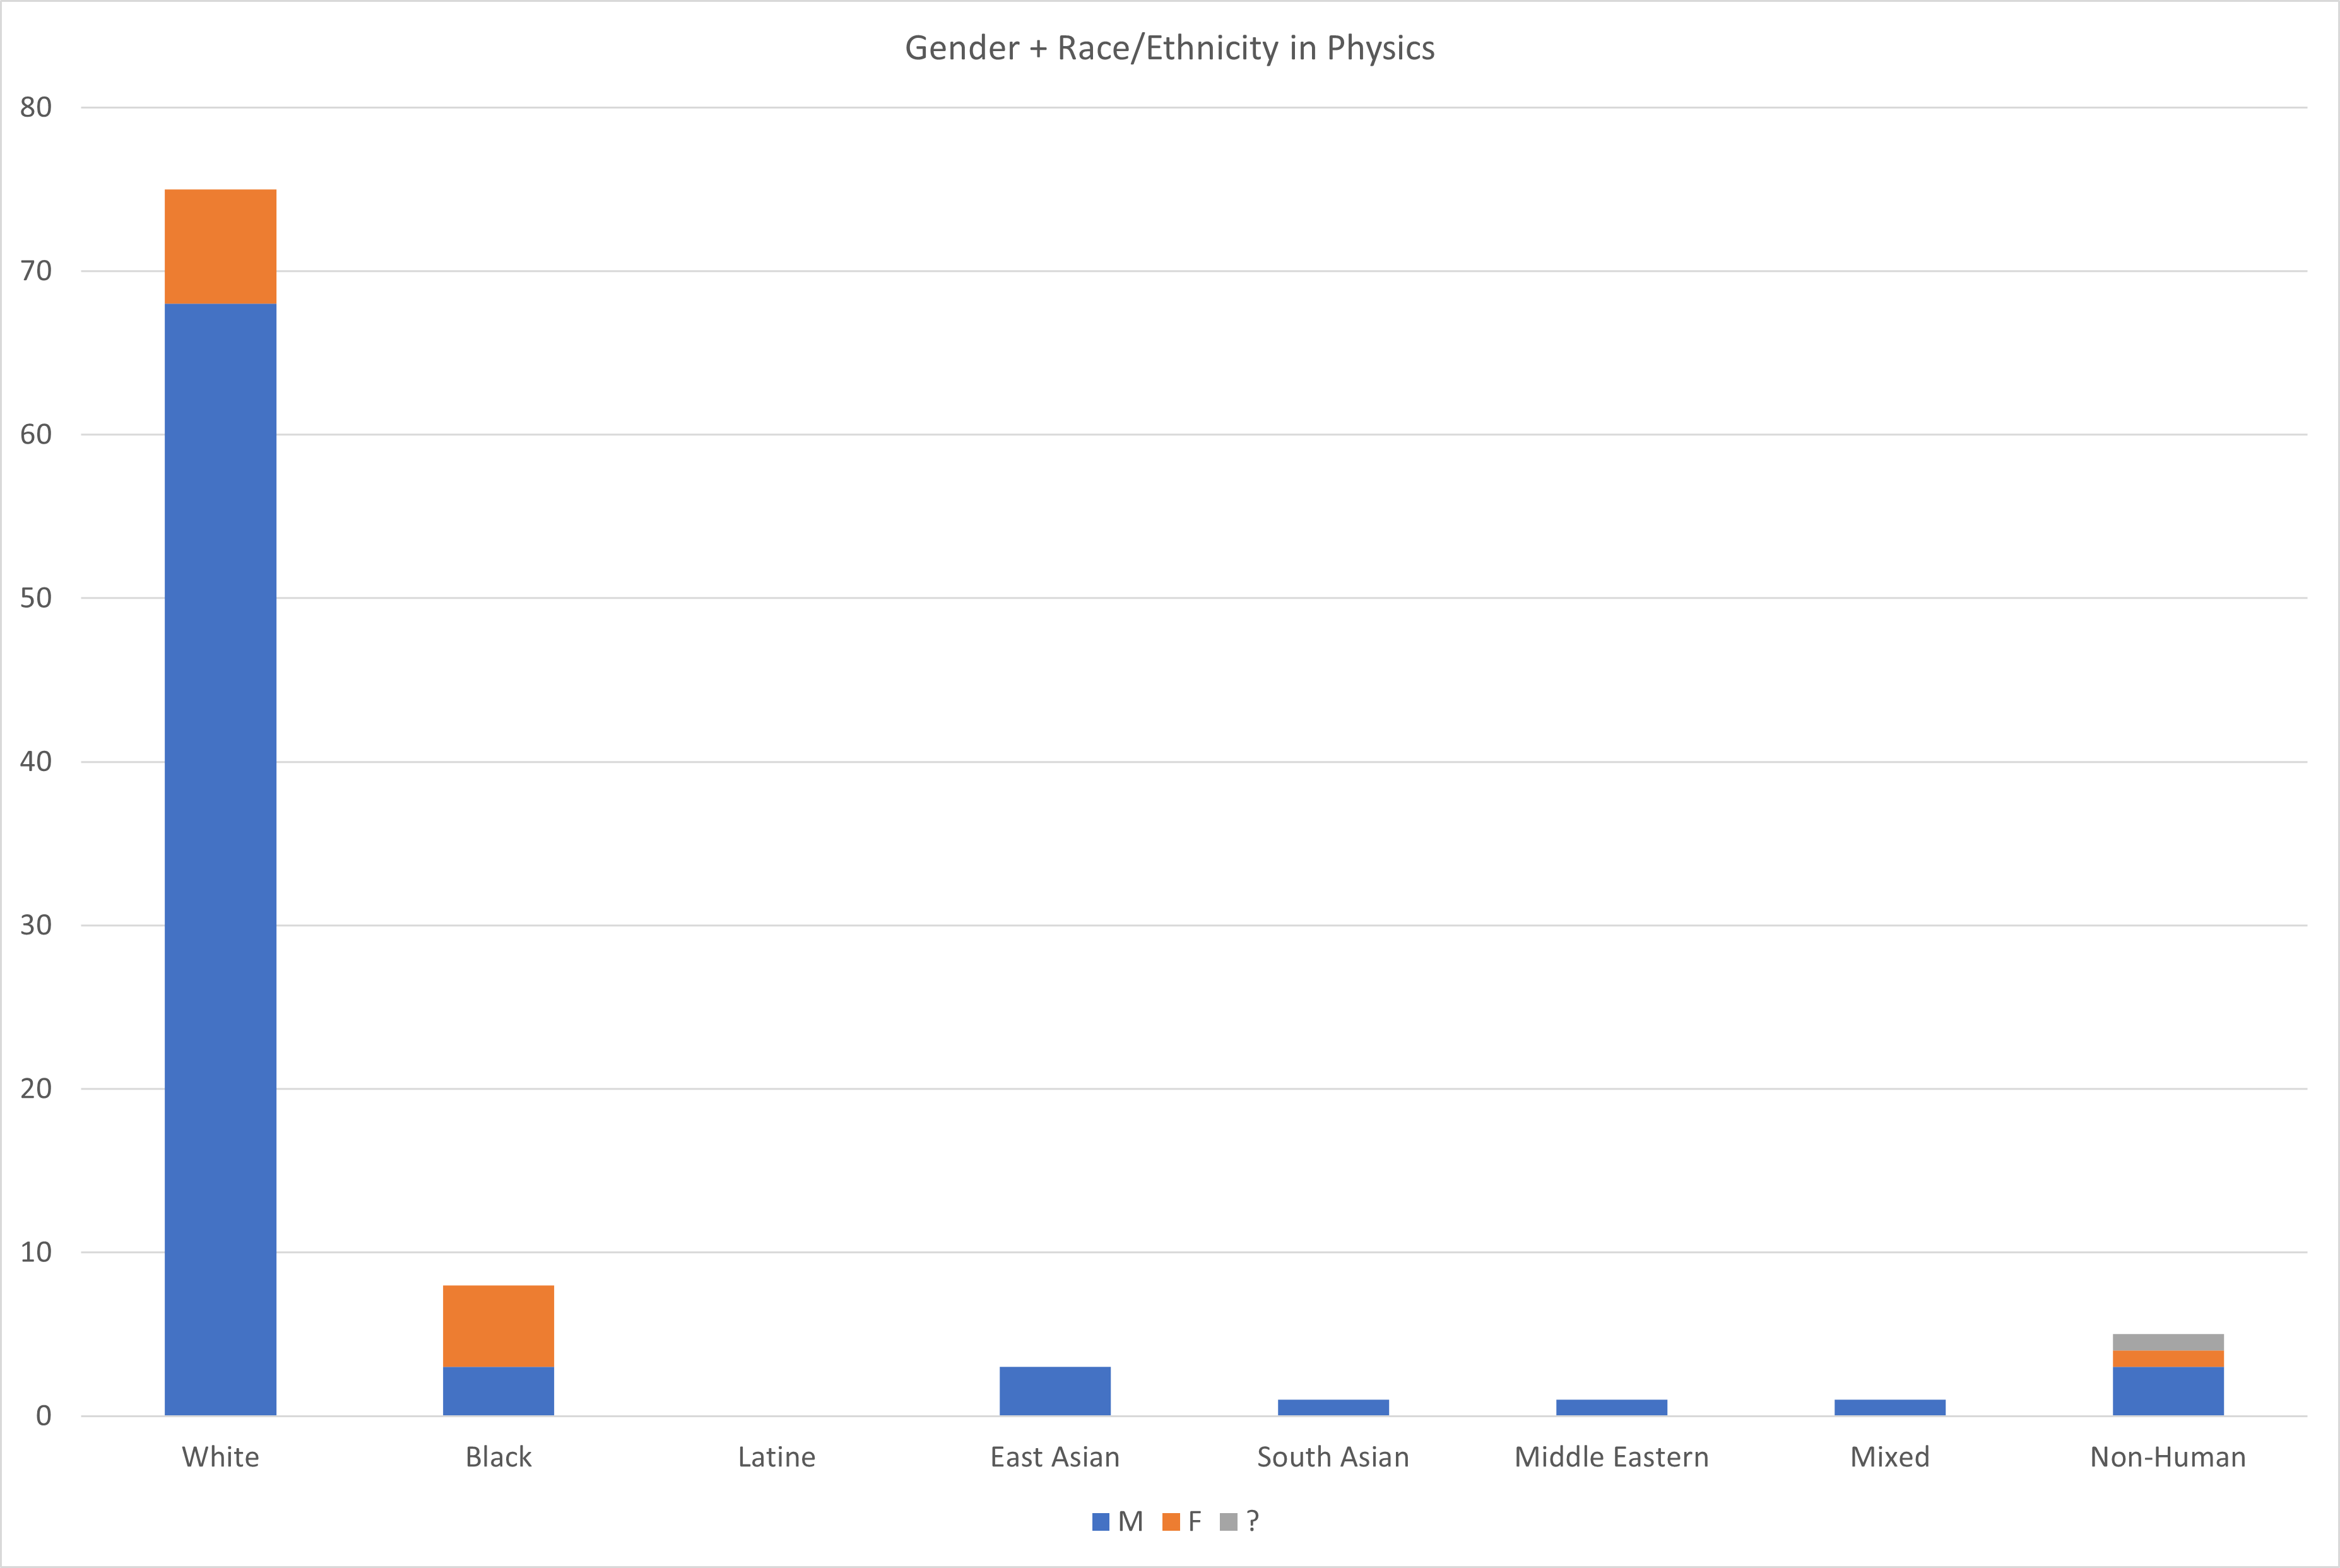
Well, let’s look at how they compare. Here are some statistics for physics demographics in the USA: Over 2014-2016, the ethnic mix of Physics PhDs earned in the USA was 87% White, 6% Asian, 4% Hispanic, 2% African American, 1% Other (AIP 2018). Between 2010 through 2016 about 20% of undergraduate and graduate degrees in physics were earned by women. (AIP 2018). These numbers are summarized in Figure 14.
|
|
Figure 14: The proportion of Americans in physics in the real world by race/ethnicity and gender.
|
The demographics for characters in popular films with physics expertise reflects this real-world disparity. In popular films the ethnic mix is 80% White, 4.3% Asian, 0% Hispanic, 8.5% African American, 7.5% Other (including non-humans: it’s the movies after all). However, the movies under-represent Latines severely, and over-represent Blacks ironically (relative to reality, which is terribly under-represented since Blacks are 13.4% of the U.S. population).
An argument could be made that the lack of diversity in STEM in film is a reflection of the real-world disparities: art imitating life. However, the majority of films are fiction, depicting what could be rather than what is. Why do they only imagine worlds where STEM is mostly the realm of white men?
Representation Matters
Does it matter that STEM characters in the movies are not diverse?
Yes! Lack of diversity in STEM role models in popular movies reinforces stereotypes and suppresses STEM identity in underrepresented groups. Representation matters.
Many film production studios have been realizing that diversifying their casts helps to diversify their audience. So it’s just good business. In addition to being good for the bottom line of the film industry, increasing the diversity of STEM characters specifically can have a positive effect on society. The movies can provide much needed role models for people who—more often than not—don’t see others like themselves in STEM roles.
Movies reflect our cultural values. If we truly value the diversity of human experience, then let's portray that on screen.

|
|
Characters from Hidden Figures (2015) depicting the Black women who worked in NASA's mathematical departments in the 1960s.
|
Appendix
I had to define what "popular" would mean for this project in order to put reasonable bounds on it. In this section, I expand a bit more on how I determined which films would make the final cut.
One way to define the popularity of a film is how much money it makes at the box office. Box Office Mojo keeps track of that kind of data. I examined their list of the 1,000 top box office films of all time, adjusted for inflation. When I first started this project (in 2019) it was only 300. The new expansion in the number of films was both exciting and daunting. They rank the films by an estimate of the number of tickets sold for each film, by dividing the box office sales by the average ticket price at the time of their releases.
There are some biases with this method. The top film, Gone with the Wind, was released in 1939 and has since had several more theatrical releases, which greatly contributed to its box office sum. This is true of many of the top films in this list like The Ten Commandments, Snow White and the Seven Dwarfs, and Star Wars. Before the era of home video in the mid-1980s, the only way for people to see old films was via theatrical re-releases or television broadcasts (more on that later). However, this additional access for audiences in new generations certainly makes those films “popular.” So this bias doesn’t concern me.
However, another important concern is that the list is very heavy on modern films (especially in the top 100), even though it has been adjusted for inflation of ticket prices (Avengers: Endgame made a lot more money than Star Wars with a much smaller audience). There are a lot of compounding reasons for this. More films are made now than in the past, so there’s more opportunity for more recent films to find a big audience. There are more venues for theatrical exhibition in more recent years. Although, it can be argued that this makes it harder for modern films to rise above the noise. Marketing for films has become more and more sophisticated as well. But my main concern is that a film that sells 20 millions tickets in 2015 is very different from selling 20 million tickets in 1945, because the population of the United States has grown so much. The U.S. population in 1920 was 106.5 million and in 2019 was 328.2 million (US Census).
|
|
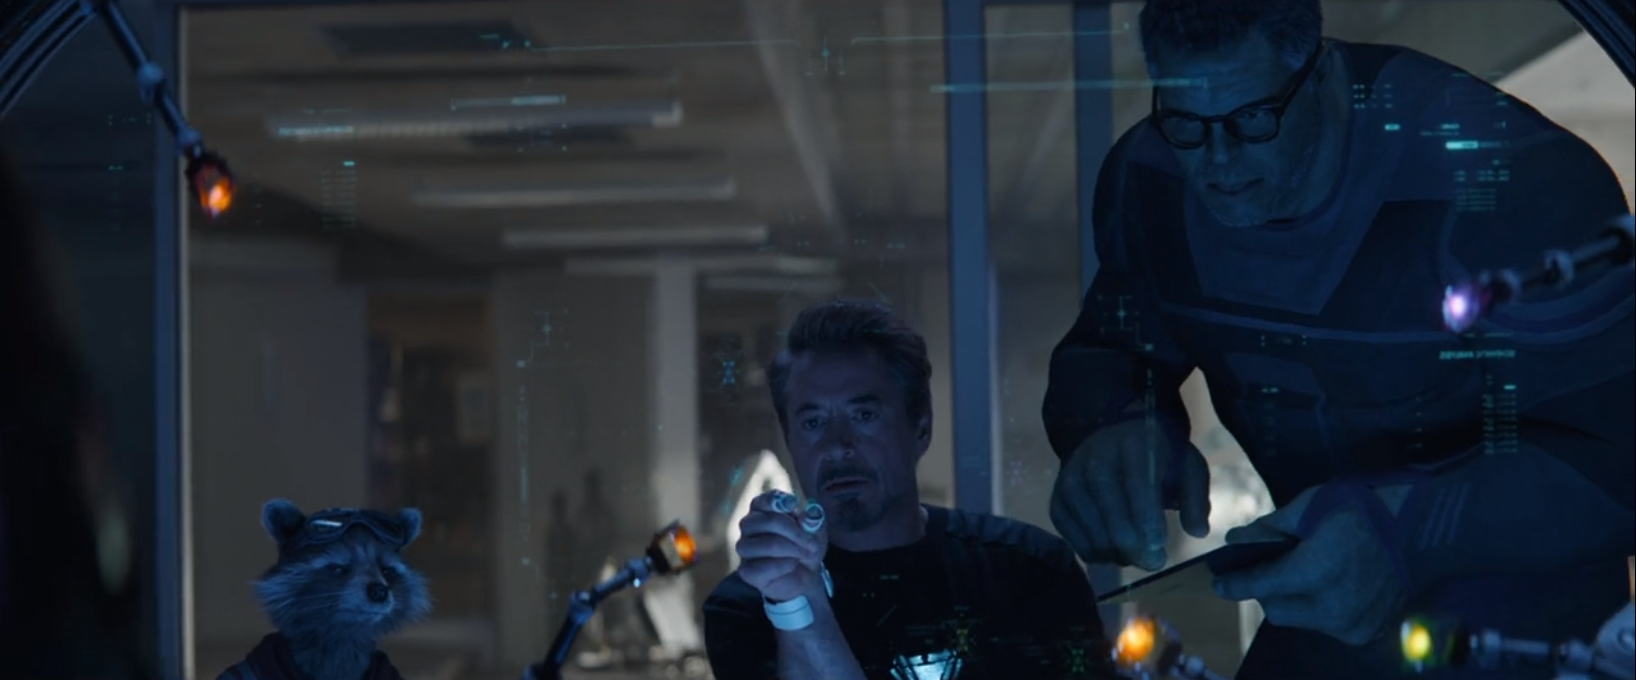
Rocket, Tony Stark, and Bruce Banner trying to determine how Avengers:Endgame (2019) made more money than Star Wars (1977), yet fewer people saw it.
|
So, I took the Box Office Mojo list and adjusted it for a ‘per capita’ calculation. I divided the number of tickets sold by the U.S. population in each decade since 1920. That gives an estimate of the percent of the population who saw the film at the time of its release. This yields some bad results for films like Gone With The Wind, because of all of the re-releases. My simple calculation suggests that the film was seen by 153% of the United States. It’s not a perfect measure, but it yields a ranking that is a good measure of what films have been popular. I think it’s fair to say that Gone With The Wind is the most popular film of all time.
Gone With The Wind doesn’t have any STEM characters in it. I noticed that a lot of the earlier decades' films had a dearth of STEM characters. I also noticed that many classic science fiction films that have permeated modern pop culture did not make the top 1000 list. So, I picked some of the most highly regarded films to add to the list and see if they might make my criteria for popular if adjusted for inflation per capita: films like Metropolis (1927), Frankenstein (1931), The Invisible Man (1933), The Day the Earth Stood Still (1951), Forbidden Planet (1956), Dr. Strangelove (1964), Fantastic Voyage (1966), and more.
Next, I decided that I needed to put some cut-off on this project so that I could actually finish it. I arbitrarily decided to use a 10% tickets sold/population ratio as my cutoff point. This only added two films from my list above to the final list: Frankenstein, and The Invisible Man.
In the final list, there were 410 films at 10% population share or greater.
Television and home video add further dimensions to popularity. The films that made this list were popular at the time they were released, to be sure. But other films, like those I’ve mentioned above, have gained more pop culture awareness over time due to being broadcast on television and cable or being made available through various home video services (from VHS rentals in the 80s to streaming services today). Consistent data to compare audiences for these different media is harder to come by. Also, I wanted to restrict my study to films to put reasonable bounds on the project that would make it possible to finish. If I start considering films that were popular on TV, then it would be reasonable to ask, “Why not also consider all the TV shows with STEM characters?”
The Geena Davis Institute on Gender in Media hired a small army to survey TV and movies for one decade of programming. It’s wonderful work; I suggest checking out their results. Since it’s just me doing this project, I had to put some reasonable bounds.
I reviewed all 410 films, a majority of which I have already seen (they are the most popular movies after all, and I’m a big movie fan). For the films I hadn’t seen, I relied on Wikipedia synopses, IMDB data on casts, and occasionally I skimmed the scripts available at thescriptlab.com.
I determined that 161 of the 410 most popular films had STEM characters important to the story. I created a list of these 161 films at Letterboxd. Star Wars is #1 and Star Trek III: The Search for Spock is #161, so it was perfectly bookended from my perspective. I also created a second list containing films worth noting for their diverse STEM characters (not neccesarily the most popular).
3241